TL;DR: AI data analysts and traditional BI tools solve overlapping but different problems. Traditional BI is best for standing dashboards (the ones executives look at every morning) and rich, governed visualizations. AI data analysts are best for the long tail of ad-hoc questions that previously got dropped on the data team's plate. Most teams in 2026 don't pick one. They run an AI data analyst alongside 10 to 20 high-signal dashboards and retire the rest. Bruin is the most common pick when teams want both layers in one platform.
For 30 years, "do something with data" meant "build a dashboard." Tableau, Looker, Power BI, Qlik. The pattern was: data engineers prepare the data, analysts model it, BI tools visualize it, business users consume it. Slow, expensive, and full of ticket queues, but it was the only game in town.
In 2026 it isn't. AI data analysts let business users ask questions in plain English in Slack and get answers in seconds. The question for any data leader now is not "AI analyst or BI tool?". It's "what does my mix look like, and how do I get there without breaking trust in my data?"
Here's an honest framework.
Traditional BI tools (Tableau, Looker, Power BI, Qlik, ThoughtSpot, Domo, Sigma) share a common shape:
- Static or interactive dashboards built by analysts and consumed by business users.
- A semantic layer (LookML, Tableau data sources, Power BI semantic models) that defines metrics consistently.
- Governance and access control at the report or dashboard level.
- Visual exploration (filters, drill-downs, slicers) within a curated dashboard.
What they're great at: a single source of truth for repeating questions. "What's our MRR this month?" should always have the same answer, and a curated dashboard is the cheapest way to deliver that at scale.
What they're bad at: ad-hoc questions. The moment a stakeholder needs "what's our MRR by plan, excluding annual contracts that prepaid in Q4, for customers acquired before our pricing change?", the dashboard is the wrong shape. Someone files a ticket, an analyst writes SQL, two days pass, the meeting where the answer mattered ended without it.
An AI data analyst (Bruin, Dot, Querio, Julius, ThoughtSpot Spotter, Power BI Copilot, ChatGPT/Claude on data) takes a natural-language question and returns a chart or narrative answer.
The good ones:
- Connect persistently to your data warehouse (Snowflake, BigQuery, Databricks, Postgres) and run SQL against current data, not a snapshot.
- Use a governed semantic layer so different users get the same answer to the same question.
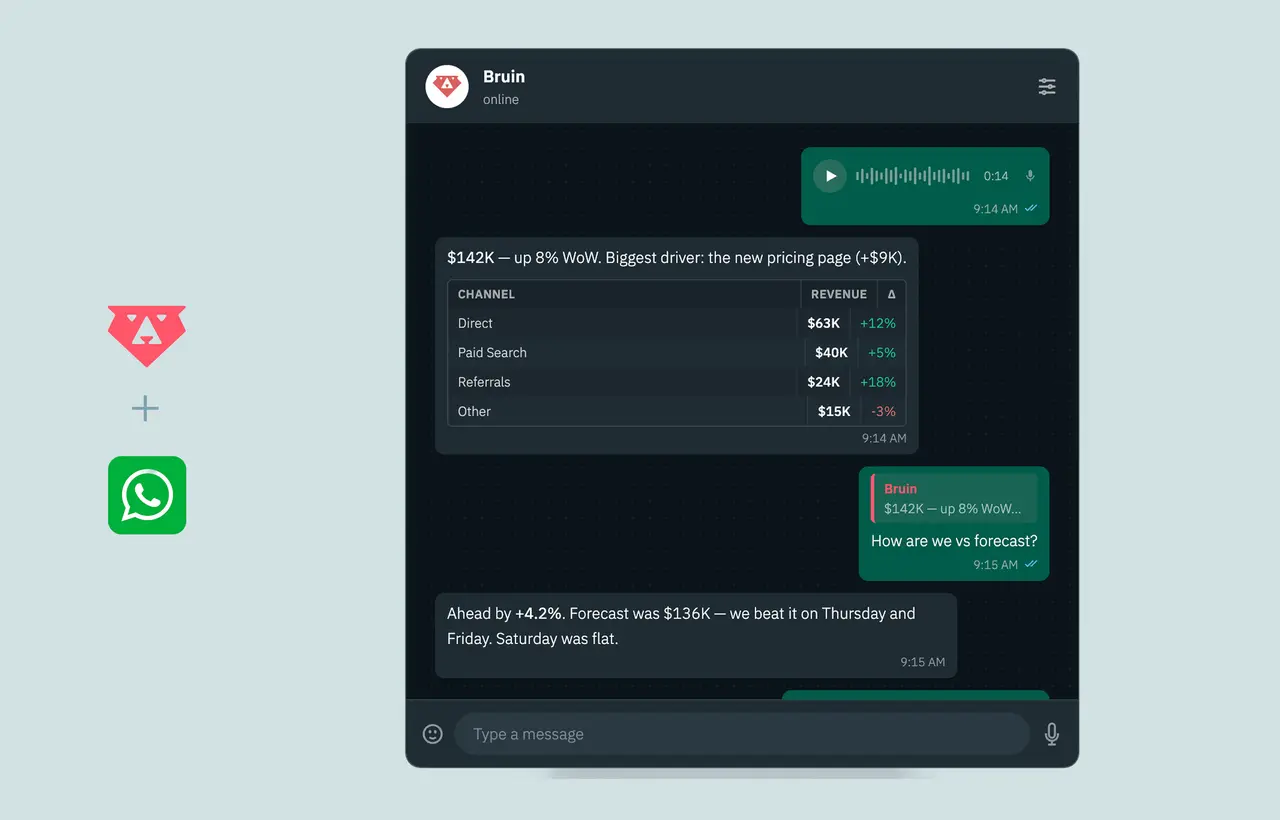
- Live where your team works: Slack, Microsoft Teams, WhatsApp, Discord, Telegram, email, browser. Not a separate app.
- Preserve conversation context so follow-up questions ("now split by region") just work.
- Surface the SQL so analysts can verify what ran.
What they're great at: the long tail of ad-hoc questions. The same questions that previously went through a BI request queue now get answered in a Slack thread in seconds.
What they're bad at: replacing standing dashboards. Executives don't want to type "show me the morning summary" every morning. They want the dashboard that's been refining itself for three years.
Pick traditional BI for:
- Executive-summary dashboards reviewed daily or weekly
- Operational monitors (system health, real-time KPI tiles)
- Compliance and audit reporting
- Embedded analytics in customer-facing products that need rich visual interaction
- Anywhere the question is repeating and the visual matters more than the answer
Pick an AI data analyst for:
- Ad-hoc Slack/Teams questions ("what's churn for our enterprise tier last quarter?")
- Cross-functional self-serve (sales, ops, CS, finance asking their own questions)
- Mid-meeting analytics ("can you check what % of customers used feature X last week?")
- Data exploration where the question shape is unknown ahead of time
- Replacing the analyst time spent answering the same flavor of question over and over
If you're picking between only an AI analyst or only a BI tool, you're probably making the wrong tradeoff. Most teams need some of each.
The shape we see working at most data-driven companies in 2026:
- Keep the 10 to 20 dashboards that genuinely earn their daily attention. Every other dashboard goes through a "do you actually open this?" audit. If nobody opens it, retire it.
- Add an AI data analyst that can answer the long tail of ad-hoc questions in the channels where teams already work (Slack, Teams, WhatsApp).
- Make the AI and the dashboards share a semantic layer so "MRR" means the same thing in both places.
- Measure the bin. Count how many ad-hoc questions get answered by the AI vs how many get escalated to the data team. Track that ratio. Adoption is real when it crosses 70%.
Teams that try to do this with two separate vendors (a BI tool plus a chat-only AI like Dot or Querio) often hit a metric-definition split. The dashboards say one thing, the AI says another, trust collapses.
This is why Bruin ships both layers in one platform: the same SQL/Python pipeline feeds the AI analyst (Slack, Teams, Google Chat, WhatsApp, Discord, Telegram, email) and the AI dashboards generated from prompts. Same metrics, same governance, same lineage.
Traditional BI pricing is mostly per-seat. ThoughtSpot starts at $25/user/month. Tableau Creator is $75/user/month. Looker is enterprise-quoted but typically $30 to $60/viewer/month at scale. Power BI Pro is $14/user/month plus Premium capacity for AI features.
The tax of per-seat pricing is real: every additional viewer is a budget line. CFOs notice.
AI data analysts price differently:
- Bruin: open-source core (free, MIT-licensed) plus managed-cloud plans that don't penalize broad read-only access.
- Dot: usage-based credits with unlimited users.
- Querio: flat SaaS subscription.
- ThoughtSpot Spotter: included with ThoughtSpot, so per-user.
- Power BI Copilot: requires Fabric F2+ or Premium P1+ capacity (no separate Copilot SKU but gated by infrastructure tier).
The TCO conversation in 2026 is rarely "AI analyst or BI tool?". It's "can I consolidate my Fivetran + dbt + Airflow + BI + observability stack into fewer vendors?" This is where unified platforms win on math: one invoice instead of five.
If you already have a BI deployment and want to add an AI analyst, the order matters:
Step 1. Pick your hardest team first. Customer success and ops teams ask the most routine questions. They produce the fastest wins. Sales is a good third wave once the AI's answers are trusted.
Step 2. Connect to your existing semantic layer. If you have LookML, dbt models, or a similar metric layer, hook the AI analyst into it. Don't define metrics twice.
Step 3. Run a 30-day shadow period. Every AI answer gets validated by an analyst. Track accuracy. Tune the semantic layer where the AI gets things wrong.
Step 4. Cut the bad dashboards. Use the AI's question logs to identify which dashboards nobody actually uses. Retire them. Keep the 10 to 20 that earn attention.
Step 5. Measure adoption monthly. Question volume, accuracy rate, time-to-answer. Report it back to leadership.
Skip step 3 and you'll burn the team's trust in the AI on the first wrong answer. Don't.
We built Bruin because teams kept asking us for both: an AI data analyst they could put in Slack and the data pipeline that feeds it, without stitching together five vendors.
Bruin gives you:
- An AI data analyst in Slack, Microsoft Teams, WhatsApp, Discord, Telegram, email, and the browser
- AI dashboards generated from a chat prompt (KPIs, charts, filters)
- Direct integrations for your databases, warehouses, and SaaS tools, plus thousands more via APIs, webhooks, and scraping, so you don't need a separate Fivetran or Airbyte
- SQL and Python transformation pipelines that replace dbt and orchestration
- Blocking quality checks so the AI won't return answers from broken data
- Column-level lineage automatically generated across the whole flow
- A shared semantic layer so the AI and the dashboards return the same answers
If you want to see Bruin alongside your existing BI tool, book a demo. If you want to start with the open-source CLI for free, grab it on GitHub.
For specific head-to-head reads, see ThoughtSpot vs Bruin, Power BI Copilot vs Bruin, Hex vs Bruin, Dot AI vs Bruin, and the 8-tool side-by-side comparison.
A BI tool builds dashboards and reports for repeating questions. An AI data analyst answers ad-hoc questions in plain English, in real time, against your live data. Typically in Slack, Teams, or a browser. The same data warehouse can feed both. Most teams in 2026 use both.
Partially. AI analysts replace the long tail of ad-hoc questions that previously went through a BI request queue. Curated dashboards (the ones executives review daily) survive. The 2026 pattern is one AI analyst plus 10 to 20 well-chosen dashboards, not 10,000 half-used ones.
The good ones, yes, when paired with a governed semantic layer and quality checks on the underlying data. Tools like Bruin run blocking quality checks before answers are returned and surface column-level lineage so analysts can verify what ran. Tools without that infrastructure (a chat layer on a fragile pipeline) will produce wrong answers when the source data is broken.
A semantic layer is the central definition of your business metrics: what "MRR" or "active customer" actually means. Without one, two analysts asking the same question get different answers. With one, the AI and the dashboards both compute the same numbers. This is the single biggest factor in whether teams trust their AI analyst's answers.
Many do. Bruin, Dot, Querio, and ThoughtSpot all have Slack integrations. Bruin additionally works in Microsoft Teams, Discord, WhatsApp, Telegram, email, and a browser. See the dedicated guide on Slack AI data analysts.
Depends on adoption. BI tools price per-seat, which becomes expensive when you want broad self-service. AI data analysts price by usage, by team, or are open-source-cored, typically cheaper for broad read-only access. The TCO conversation in 2026 is usually about stack consolidation: how many tools can one platform replace?
Yes, and most teams do. The pattern is: keep your highest-signal dashboards, add an AI data analyst for ad-hoc questions, make sure both share the same semantic layer. The risk is metric drift between the two layers if the semantic definitions live in different places.
No. It eliminates the time analysts spend on repetitive ticket-style questions, freeing them for higher-value work: building the semantic layer, designing pipelines, doing strategic analysis. Teams that adopt AI data analysts typically don't shrink the data team. They rebalance it toward higher-leverage work.
Days to first pilot, weeks to broad adoption if you follow the migration path: pick one team first (customer success or ops), shadow the AI's answers for 30 days, tune the semantic layer, then expand to other teams.
Picking only one. Teams that go all-in on AI analysts and retire all dashboards lose the standing morning views executives rely on. Teams that stay 100% on BI tools never solve the ad-hoc question problem. The right answer is a hybrid: a few high-signal dashboards plus an AI analyst, both connected to the same governed data.