If you're a data engineer, your typical day involves constant context switching: writing code in VS Code, running pipelines from the terminal, checking logs in a CLI, and jumping to a browser to visualize lineage or job status. This fragmentation kills productivity and breaks your flow.
Bruin was founded to solve exactly this problem. We believe data teams deserve the same seamless, unified experience that software engineers enjoy, one place to think, build, run, and debug. That's why we created the Bruin VS Code Extension, which brings the full power of the Bruin CLI (asset management, pipeline execution, quality checks) directly into your editor.
Native VS Code UI components work fine for simple status bars or tree views. But for rich experiences like interactive data lineage graphs, live query previews, and asset editors, we needed more power. That's where Webviews powered by Vue.js come in.
A VS Code extension with Vue.js webviews means building two distinct applications that live side-by-side in one repository:
Node.js Extension webview-ui (Vue App)
├── extension.ts ├── package.json
├── commands/ (CLI bridge) ├── vite.config.js
└── panels/ (webview mgr) └── src/
├── components/
└── stores/
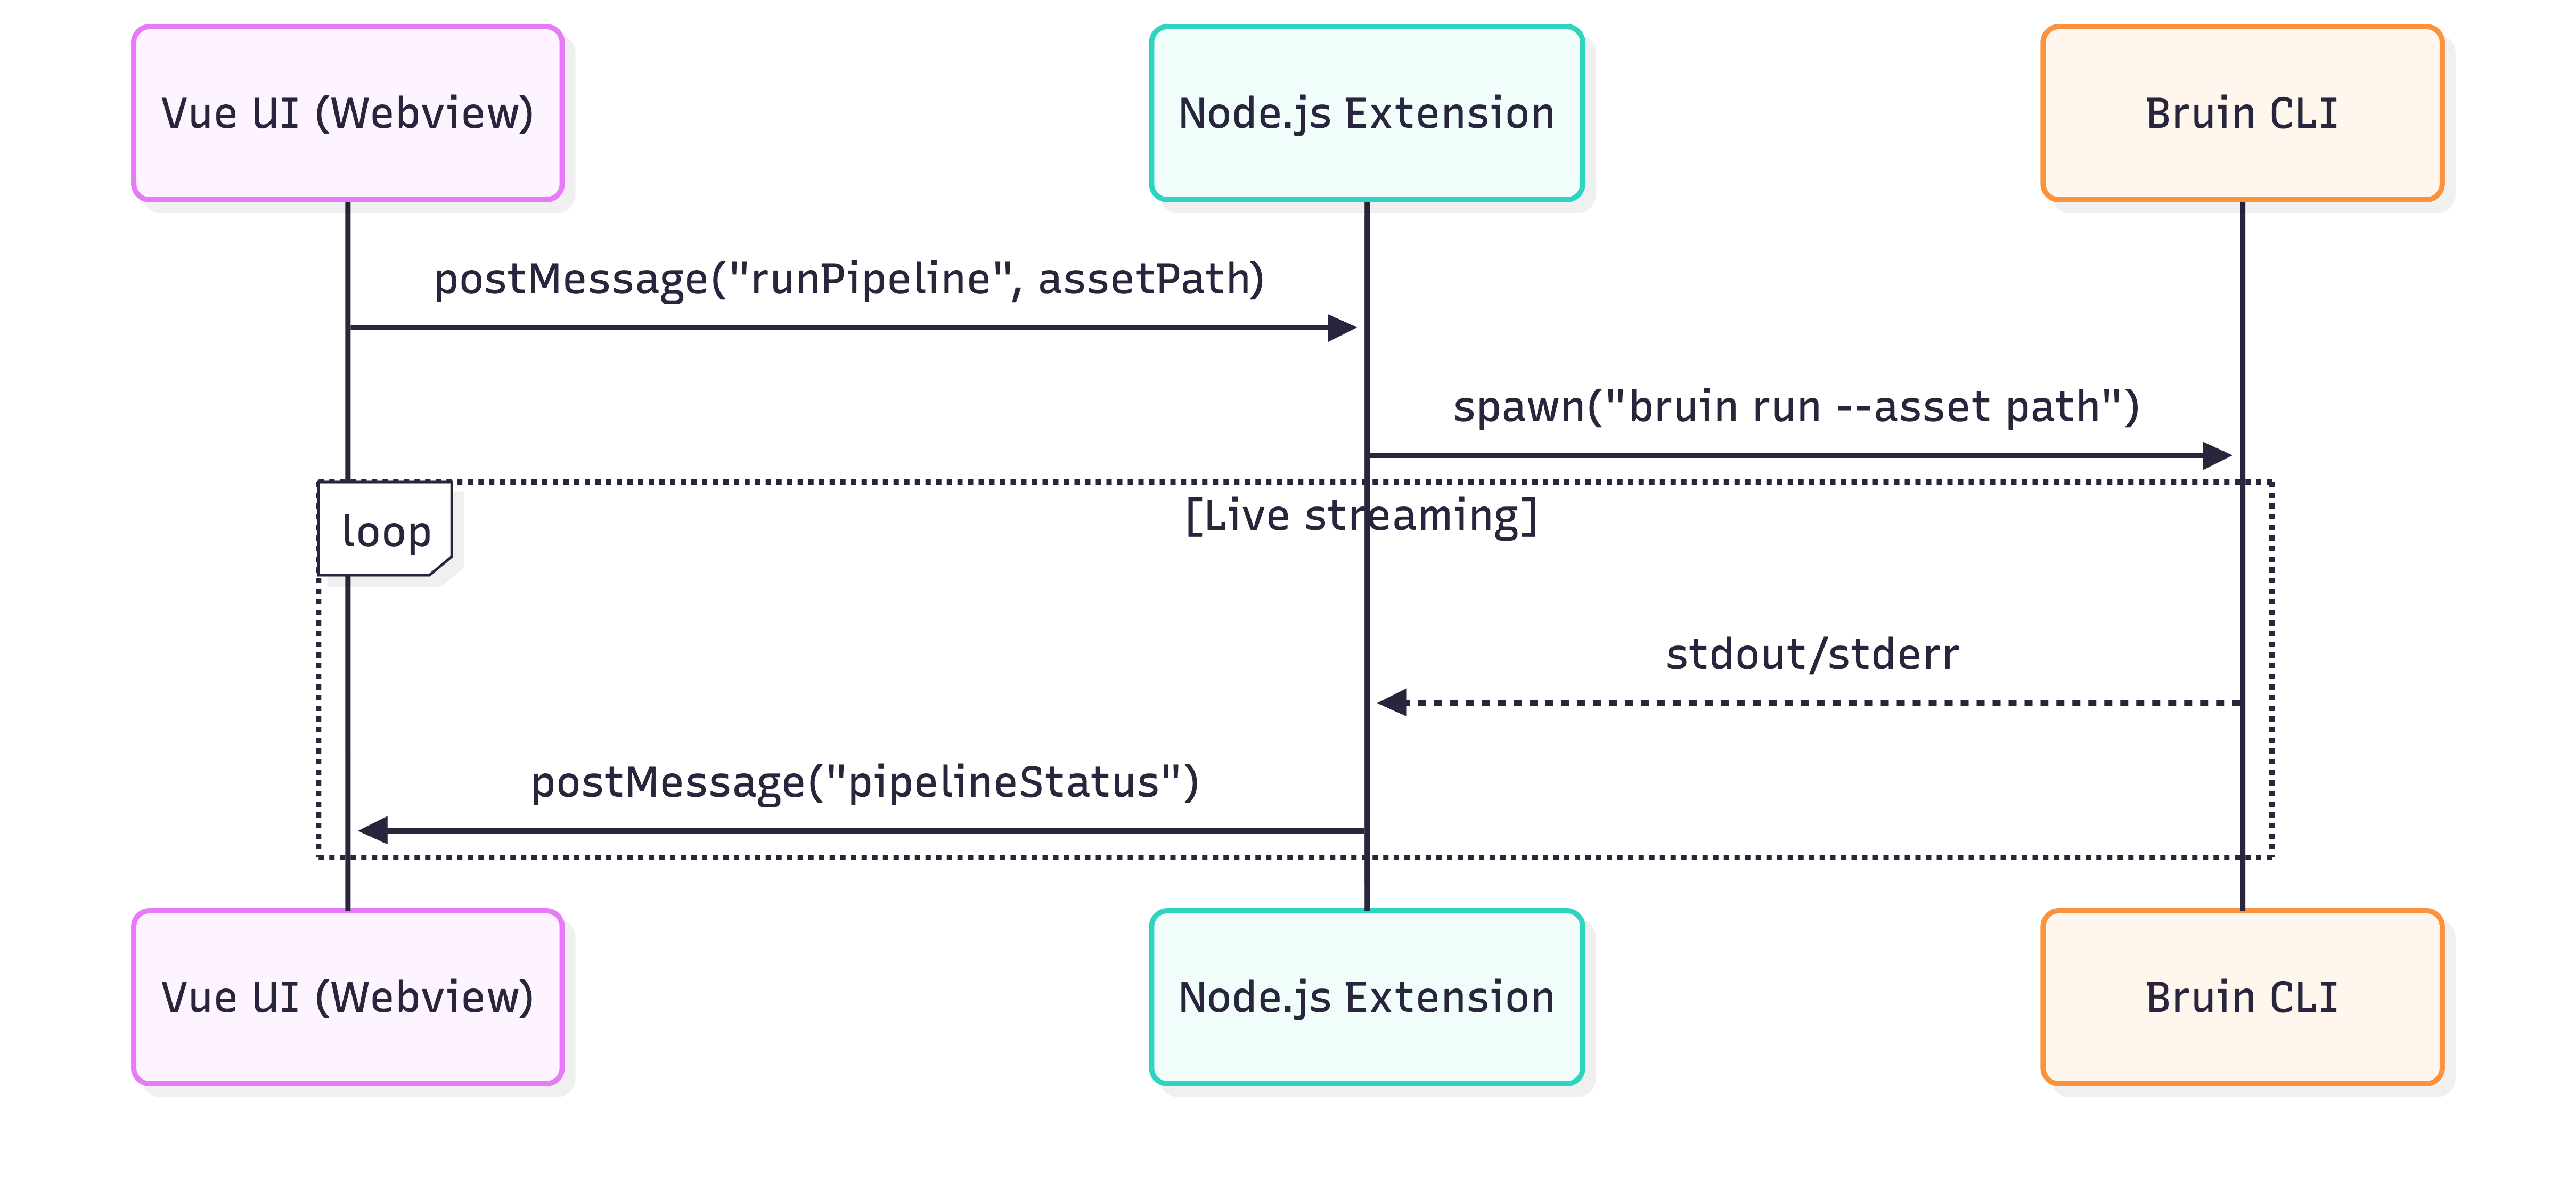
The Node.js extension runs in VS Code's host process. It handles workspace context, registers commands, manages panels, and acts as a secure bridge to the local Bruin CLI.
The Vue app runs inside a sandboxed webview (essentially a browser iframe). It renders everything the user sees: lineage graphs, asset details, connections and databases, query results, etc. The app is built with modern tooling: Vue 3, TypeScript, Vite, Pinia, and compiles to static assets that the extension serves.
Since webviews can't directly access Node.js APIs, all communication happens through structured JSON messages using VS Code's postMessage API.
// Webview side - simple intent
import { vscode } from "@/utilities/vscode";
const runPipeline = () => {
vscode.postMessage({
command: "runPipeline",
payload: messagePayload
});
};
// Extension side - handles the real work
webview.onDidReceiveMessage(async (message) => {
if (message.command === "runPipeline") {
const payload = message.payload;
// Execute Bruin CLI and send updates back to UI
const results = await executeBruinCLI(payload);
webview.postMessage({
command: "pipelineStatus",
payload: results
});
}
});
// Vue handles responses reactively
const handleMessage = (event) => {
const message = event.data;
if (message.command === "pipelineStatus") {
const payload = message.payload;
// Update the UI with the payload
}
};
Here's the full round trip when you click "Run Pipeline":
- User Action: Click "Run Pipeline" button in Vue component
- Vue → Extension:
vscode.postMessage({ command: "bruin.runPipeline", payload }) - Extension Processing:
- Resolves current pipeline path
- Builds CLI command with flags (
--start-date, --end-date, etc.) - Executes
bruin run in VS Code's integrated terminal
- CLI Execution: Bruin CLI runs the pipeline, streams output to terminal
- Extension → Vue: Sends status updates via
webview.postMessage() - Vue Updates: Reactive UI changes

Challenge: Hot reloading during development requires careful setup.
Solution: We use Vite's dev server for the Vue app, but webviews need special handling. The extension serves built assets via webview.asWebviewUri(), so we run vite build --watch during development and manually refresh the webview panel. (more details in the next blog post)
# Development workflow
npm run dev:watch # Runs TypeScript compiler + Vite watch mode concurrently
Challenge: Debugging webview messages requires understanding where logs appear in each context.
Solution: VS Code provides different debugging tools for each part:
- Vue/webview: Right-click the webview panel → "Open Webview Developer Tools" to see Vue console logs, inspect components, and debug message passing
- Extension/Node.js: When debugging, logs appear in the Debug Console.
Challenge: Large message payloads make the UI feel laggy, and sending messages when webviews aren't ready wastes resources.
Solution: Be mindful about when and how often you send messages:
- Check webview visibility: Only send messages when the webview panel is visible (
webview.visible). Don't send until components are mounted and ready to receive data - Use debouncing: Debounce rapid file changes (180ms for graph updates, 500ms for asset detection) to prevent message flooding
- Keep payloads small: Aim for <10KB when possible. For large data like lineage graphs, use duplicate detection on the client side to skip processing identical messages
Challenge: Webview state is lost when panels are hidden or recreated.
Solution: We use Pinia stores for reactive state, and VS Code's webview.getState() / setState() for persistence:
✗ Before: VS Code → Terminal → Browser → Terminal → Browser...
✅ After: Everything happens inside VS Code
Data engineers can now:
- Open a Bruin asset file and instantly see asset details, lineage graph, connections, metadata and more.
- Click "Validate" or "Run" and get the same reliable CLI behavior with a richer, more discoverable interface.
- Edit tags/metadata and validate with one click.
- Preview query results without opening another tool.
- Visualize data lineage interactively with expandable nodes.
- Manage connections directly from the UI.
- Format SQL assets with SQLFluff integration.
- A lot more features to discover...
Install from VS Code Marketplace
or from the Open VSX Marketplace
We are open to contributions! Please feel free to open an issue or a pull request.
GitHub Repository