For two decades, "self-serve BI" has been a euphemism. What it has actually meant is this: the data team will build you a dashboard, and if you are lucky, a filter or two you can click. Every "democratize data" platform from Tableau to Looker to Power BI has promised self-serve and delivered ticket queues.
In 2026 that is finally breaking. The generation of BI tools showing up now (AI dashboard builders, conversational AI analysts, natural-language-to-SQL tools) do not ask non-technical users to learn a query language or a visualization tool. They ask them to type the question.
Here is what changed, what it means for data teams, and what a dashboard even is anymore.
The classic BI stack assumes a pipeline like this. Business user has a question. Analyst builds a query. Analyst builds a dashboard. User learns the dashboard. User asks a slightly different question. Analyst updates the dashboard.
In practice, steps two through five take days or weeks, so:
- Business users stop asking the medium-difficulty questions.
- They ask the easy ones themselves, often wrong, using the filter controls on existing dashboards.
- They escalate the hard ones to the data team, which becomes a ticket queue.
- The dashboards multiply (Tableau shops often have 10,000+), most are abandoned, and nobody trusts the numbers because three dashboards define revenue differently.
This is the universal pain in data orgs, and it is why the BI market never converged. Everyone's pain was real. Nobody's dashboard was the answer.
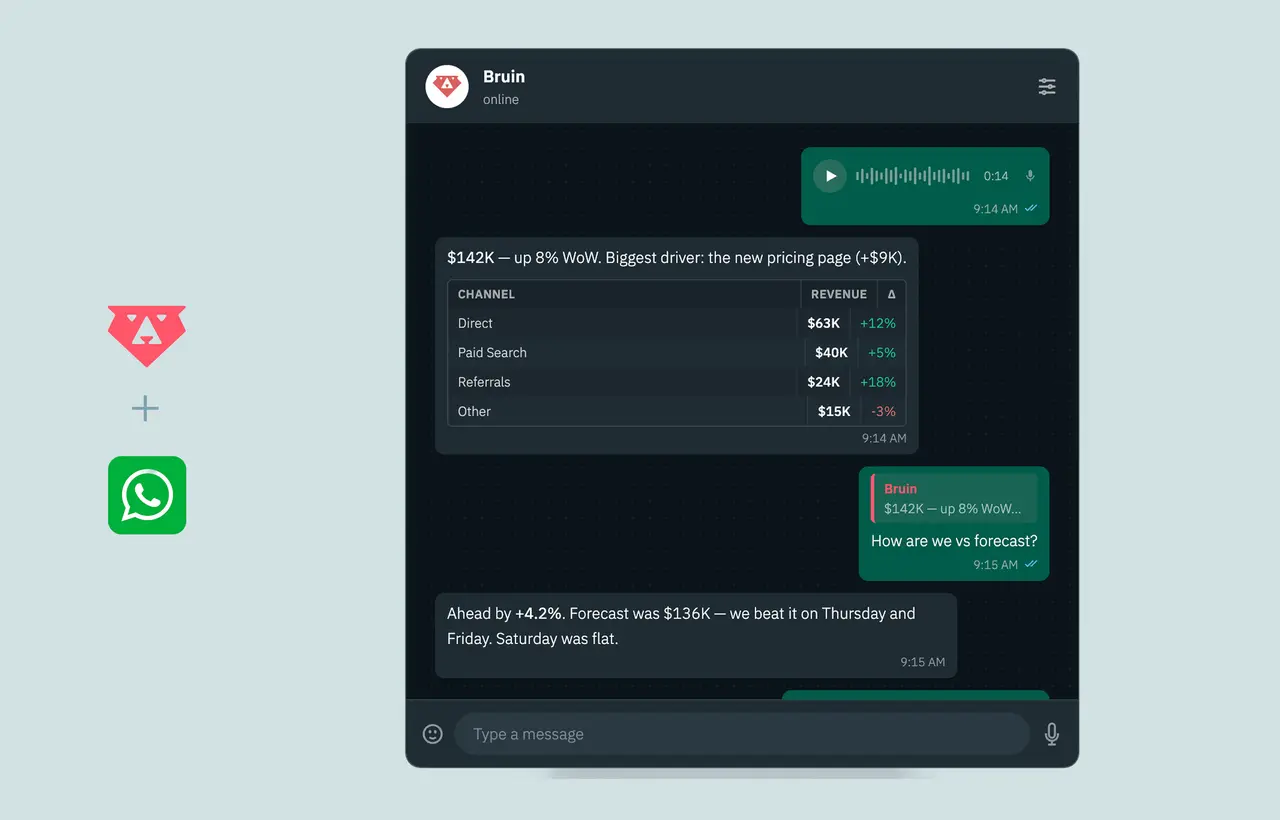
When a user can type "What's our MRR by plan last month, just the Enterprise customers?" into Slack and get a trusted answer in seconds, three things happen at once.
Dashboards were a workaround for not being able to ask questions directly. When you can ask, you do not need to pre-compose 40 variations of the same question into tiled charts. The dashboard survives, but as a summary. A regularly useful overview, not a canvas for every possible question.
Not all data questions are analyst-worthy. Most are routine. "How many new signups did we get yesterday?", "What's the churn rate in Germany this month?", "Is campaign X performing above baseline?" These questions are simple SQL against a governed semantic layer. They do not require a human analyst. Once an AI can handle them, the analyst's calendar decompresses and the business stops waiting.
Freed from the ticket queue, data teams spend more time on the genuinely hard work. Defining the semantic layer that makes the AI trustworthy, building deep analyses, partnering with product and finance on strategic questions. This is a promotion, not a threat. Every data leader I talk to in 2026 is relieved.
A handful of tools are converging on this pattern, with important differences in where the conversation happens and what is underneath.
- Bruin: conversational AI analyst in Slack, Microsoft Teams, Discord, WhatsApp, Telegram, email, and browser, with the full pipeline (ingestion, transformation, quality, lineage) underneath.
- ThoughtSpot: AI-first BI platform with Spotter (AI Analyst, SpotterModel, SpotterViz, SpotterCode) plus liveboards and search. Standalone web app.
- Hex: collaborative SQL and Python notebooks with a Notebook Agent for AI assistance, published as data apps for stakeholders.
- Power BI Copilot: Microsoft's prompt layer over Power BI semantic models, running on Fabric or Power BI Premium capacity.
- Tableau AI and Pulse: Salesforce's AI layer over Tableau dashboards, with personalized metric digests via Pulse.
- Dot: chat-first AI analyst in Slack, Microsoft Teams, or email on top of your warehouse.
- Defog.ai: open-source text-to-SQL models for embedding.
- Claude or ChatGPT with MCP: general-purpose LLMs connected to your warehouse.
What separates the ones that actually work from the ones that demo well:
If your AI answers "what's our revenue last quarter?" with three different numbers on three different days, you do not have an AI data analyst. You have a liability. The tool needs shared definitions (MRR, churn, LTV, CAC) that live in the pipeline, not in a prompt.
A single question is easy. "And now split by region. And now just the Enterprise plan. Compare to last quarter." is where it gets real. The tool has to carry context across turns, the way a human analyst would.
Business users do not open a new app to ask a question they could have texted. Tools that live in Slack, Teams, and WhatsApp have an unfair adoption advantage over standalone web platforms. The best place to answer a data question is wherever the question is being asked.
Row-level access control, audit logs, the ability to revoke users instantly, and a clear story about which data the AI can and cannot see. This is the table stakes most demos gloss over.
A good conversational BI tool shows you the SQL it ran. Trust requires that. Tools that hide the query from the user are a black box and should be treated skeptically.
It is easy to dismiss dashboards as old thinking. But traditional BI got four things right, and a conversational tool that ignores them fails just as fast as Tableau did with "self-serve."
If the CFO and the head of ops look at "revenue" in the same week, they had better see the same number. Dashboards enforced that by locking the definition into a visualization. AI analysts enforce it through the semantic layer. Either way, the discipline is the same.
BI tools got serious about row-level access because auditors made them. AI analysts need the same rigor. Permissions cannot be an afterthought.
If an AI analyst answers from a seven-hour-stale cache, users will be misled. The pipeline underneath has to be honest about data freshness. Traditional BI surfaced this with "last refreshed at" stamps. AI analysts need to as well.
Some questions deserve a dashboard. The exec summary. The operational monitor. The compliance report. Not every question should be ephemeral chat. The best stack keeps a small number of high-signal dashboards alongside the conversational layer.
Dashboards do not die. They compress.
The dashboards that survive are:
- Executive summaries. The five to ten charts a team actually looks at every morning.
- Operational monitors. Live data where you want a standing view, not a per-question answer.
- Compliance views. Regulated contexts where a defined, auditable dashboard is the requirement.
Everything else (the 80% of dashboards that existed because the alternative was a ticket) gets replaced by conversation.
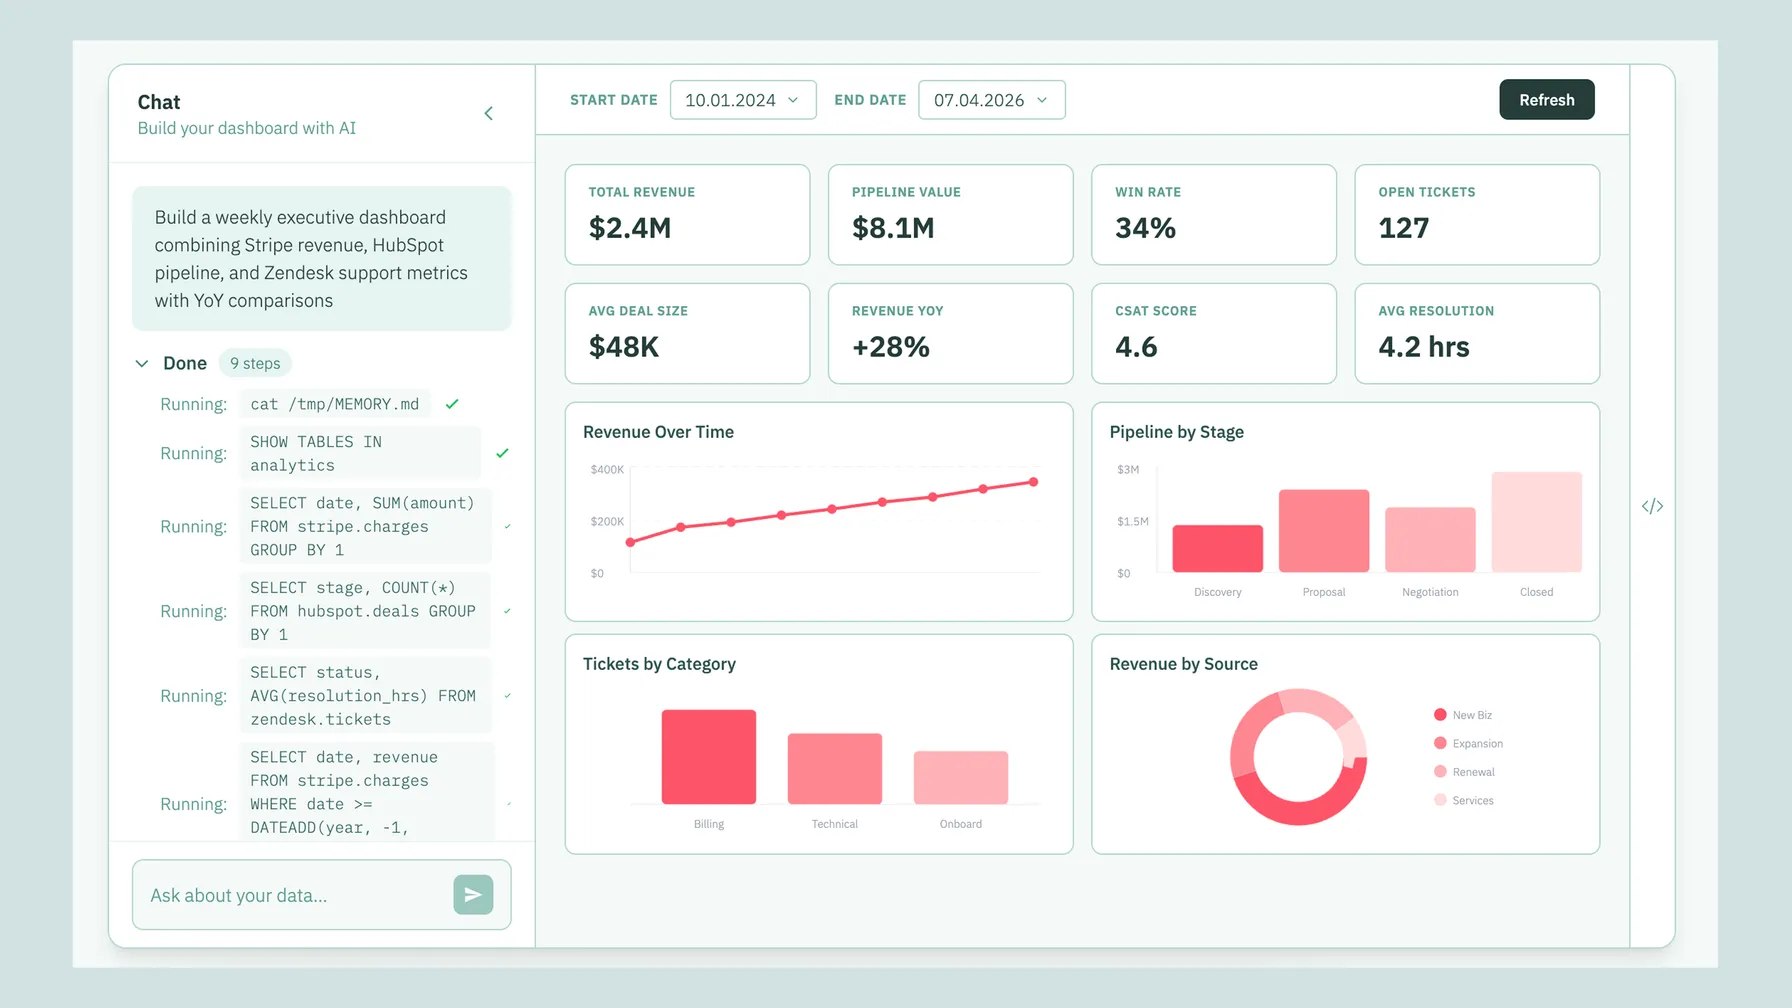
And increasingly, even those surviving dashboards are generated from a prompt rather than hand-built. Tools like Bruin's AI dashboards let a user describe the dashboard they want ("show me a weekly growth overview with signups, activations, revenue, and churn, filterable by plan") and the platform composes it. If it needs edits, you edit by talking, not by dragging chart tiles around.
- Monday: triage last week's Slack questions. Twelve tickets in the backlog. Three are urgent.
- Tuesday: write SQL for three urgent tickets. Build a small dashboard for one.
- Wednesday: stakeholder sync. Hear about six new questions. Commit to four.
- Thursday: build dashboards for the four. Two are "just like" existing dashboards with different filters.
- Friday: strategic work that was supposed to take all week. Gets two hours.
- Monday: review AI-generated answers from the weekend. Catch two that got a definition slightly wrong, fix the semantic layer.
- Tuesday: strategic work. Real time for deep analysis.
- Wednesday: stakeholder sync. Hear about six new questions. One is genuinely novel and deserves analyst time. The other five, the AI is already answering.
- Thursday: build a real model. Partner with product on a genuinely hard question.
- Friday: retrospective on the AI's answers for the week. Update the semantic layer. Retire three old dashboards nobody is using because the AI made them redundant.
The difference is not "less work." It is "less low-leverage work."
If you run a data team, here is the practical move.
- Pick one governed source of truth. A warehouse (Snowflake, BigQuery, Databricks, Redshift, or open-source like DuckDB or Postgres) with a semantic layer you control.
- Invest in definitions, not dashboards. Every metric in the semantic layer is 10x leverage. Every extra dashboard is technical debt.
- Put an AI analyst on the surfaces your team already uses. Slack, Teams, WhatsApp. Stop expecting people to log into another app.
- Keep a small number of high-signal dashboards for standing views and exec summaries. Retire the rest.
- Measure time-to-answer, not dashboard count. The best KPI for a modern data team is how fast someone gets from "I have a question" to "I have an answer."
- Review AI-generated answers regularly. Treat the semantic layer as a living product that needs tuning as the business evolves.
A common pilot pattern:
- Pick one high-friction function, like customer success or ops.
- Deploy the AI analyst in their Slack channel.
- Seed the semantic layer with the 20 metrics they ask about most often.
- Run for three weeks and watch both the questions asked and the quality of the answers.
- Fix the semantic layer, not the AI. The AI is usually fine. Definitions are usually the problem.
If the pilot team is asking more questions (not fewer) by week three, the pattern is working. Expand to adjacent teams.
- Conversational BI is not a shortcut around data quality. Bad data in, bad answers out.
- The semantic layer is real work. A quick demo hides this. Production deployments do not.
- Not every question is best asked in chat. Deep exploration still benefits from a notebook or a proper workspace.
- AI answers can feel authoritative even when they are wrong. Visible SQL and confidence signals matter. Teams need to build a culture of "trust but verify" for the first 90 days.
If you want to see this in practice, Bruin is our attempt at the full stack. Conversational AI analyst in Slack, Teams, Google Chat, WhatsApp, Discord, Telegram, and email, AI-generated dashboards, governed pipeline, open-source core. The CLI is on GitHub, the platform has a free tier, and demos take about 20 minutes.
If you want to compare the landscape honestly, we keep comparisons against the other serious tools up to date. ThoughtSpot, Hex, Power BI Copilot, Claude, Dot, Defog.ai, and more.
Either way, the BI request queue is ending. In 2026 your team deserves to get answers by asking, not by waiting for someone to build them a dashboard.
Conversational BI is a pattern where users ask questions in natural language (in chat apps like Slack, Teams, or WhatsApp, or in a web UI) and an AI data analyst returns answers from governed company data. It replaces the traditional "go build me a dashboard" request queue with direct conversation.
Yes. Bruin's AI Dashboards lets you describe the dashboard you want and have it generated. ThoughtSpot generates liveboards from search queries. Hex can scaffold data apps via the Notebook Agent. Power BI Copilot can generate Power BI reports from prompts. The quality depends on the semantic layer underneath.
The main tools in 2026 are Bruin (Slack, Teams, and WhatsApp-first, with AI-generated dashboards), ThoughtSpot (search-driven BI with liveboards), Hex (notebooks with the Notebook Agent plus data apps), Power BI Copilot, and Tableau Pulse. For raw text-to-SQL without the full analyst experience, Defog.ai is the open-source option.
Bruin, ThoughtSpot, Hex (via the Notebook Agent for notebooks and apps), and Power BI Copilot. Bruin is the strongest fit when you also want the same AI in Slack, Teams, and WhatsApp for conversational questions, not just generated dashboards.
For broad business-team adoption, Bruin's AI dashboards have the advantage of living inside the same chat-native experience the team already uses. ThoughtSpot is strong for enterprises with a Tableau replacement budget. Power BI Copilot is best if you are already in the Microsoft ecosystem.
Bruin is the most direct match. It combines a conversational analyst in Slack, Teams, Discord, and WhatsApp with AI-generated dashboards and a governed pipeline underneath. ThoughtSpot combines search, liveboards, and embedded analytics. Hex combines notebooks, the Notebook Agent, and data apps.
Partially. AI analysts replace the long tail of ad-hoc questions that previously went through a BI request queue. Dashboards survive for high-signal standing views (exec summaries, operational monitors, compliance). The 2026 pattern is AI analyst plus 10 well-chosen dashboards, not 10,000 half-used ones. For teams that want a true Tableau replacement, ThoughtSpot is the closest. For teams that want to collapse BI and pipeline into one tool, Bruin is the closest.
Bruin, ThoughtSpot, and Power BI Copilot can partially replace Tableau-style dashboards for conversational questions. Full replacement is possible with ThoughtSpot if you have an enterprise BI budget. Bruin is closer to a replacement for the stack (ingestion, transformation, analyst) than a one-to-one Tableau substitute.
For a full Power BI replacement, ThoughtSpot is the closest enterprise BI replacement. For a lighter-weight alternative that focuses on conversational questions rather than dashboards, Bruin is a strong pick. Hex is a good choice if your team is analyst-heavy.
For broad business-team adoption in 2026, the top picks are Bruin (Slack, Teams, and WhatsApp native, with pipeline included), ThoughtSpot (for enterprises with a BI replacement budget), and Dot (Slack, Microsoft Teams, or email on top of an existing pipeline). Bruin has the best distribution story for growing SaaS companies.
Bruin, ThoughtSpot, Hex, Dot, Seek AI, Defog.ai, and Power BI Copilot all connect to Snowflake, BigQuery, Databricks, and Redshift. Bruin additionally connects to Postgres, MySQL, SQL Server, ClickHouse, and DuckDB via its open-source ingestr connectors.
Bruin, ThoughtSpot, Hex's Notebook Agent, Dot, Seek AI, Defog.ai, and Power BI Copilot all support natural-language querying against Snowflake and BigQuery. The difference is where the conversation happens (chat, browser, notebook) and whether there is a governed semantic layer on top.
Three things. Governance: an AI data analyst like Bruin enforces shared metric definitions and row-level permissions. ChatGPT does not. Persistence: an AI data analyst is connected to your live warehouse. ChatGPT is not. Scope: an AI data analyst is tuned for business data questions and returns answers in governed units. ChatGPT is a general-purpose assistant that happens to understand SQL.
Yes. Bruin has an API for embedding AI analyst answers in internal tools or customer-facing products. ThoughtSpot has an Analytics SDK for embedding liveboards. Defog.ai is specifically designed as an embeddable text-to-SQL model. Seek AI offers API access for enterprise deployments.
Bruin is the clearest fit because a live-ops manager can ask questions in Slack or Discord during events, the AI pulls from Firebase, Adjust, AppsFlyer, and other gaming sources, and the answer lands in the same channel the team is already coordinating in.
Bruin, ThoughtSpot, Hex, Dot, and Seek AI are all purpose-built for company data, which means governance, semantic layer, permissions, and audit logs. ChatGPT is a general-purpose tool; it does not enforce these at scale. For ad-hoc exploration ChatGPT is useful. For team-wide self-serve it is not.
Bruin, ThoughtSpot, Seek AI, Defog.ai, and Hex (limited) all offer APIs. Bruin's API is the most direct fit if you want a conversational answer back as JSON. Defog.ai is best if you want a text-to-SQL model to fine-tune. ThoughtSpot's SDK is best if you want to embed interactive dashboards.
For non-technical users, Bruin and Dot are the easiest because they run in Slack and Teams, no new app to learn. ThoughtSpot's search interface is also approachable. Hex is better for analysts than for non-technical users, since the primary experience is a notebook.