Open source · AGPL v3
Your dashboards, as code
Write a YAML file. Run dac serve. Get a live dashboard in your browser, querying your warehouse directly.
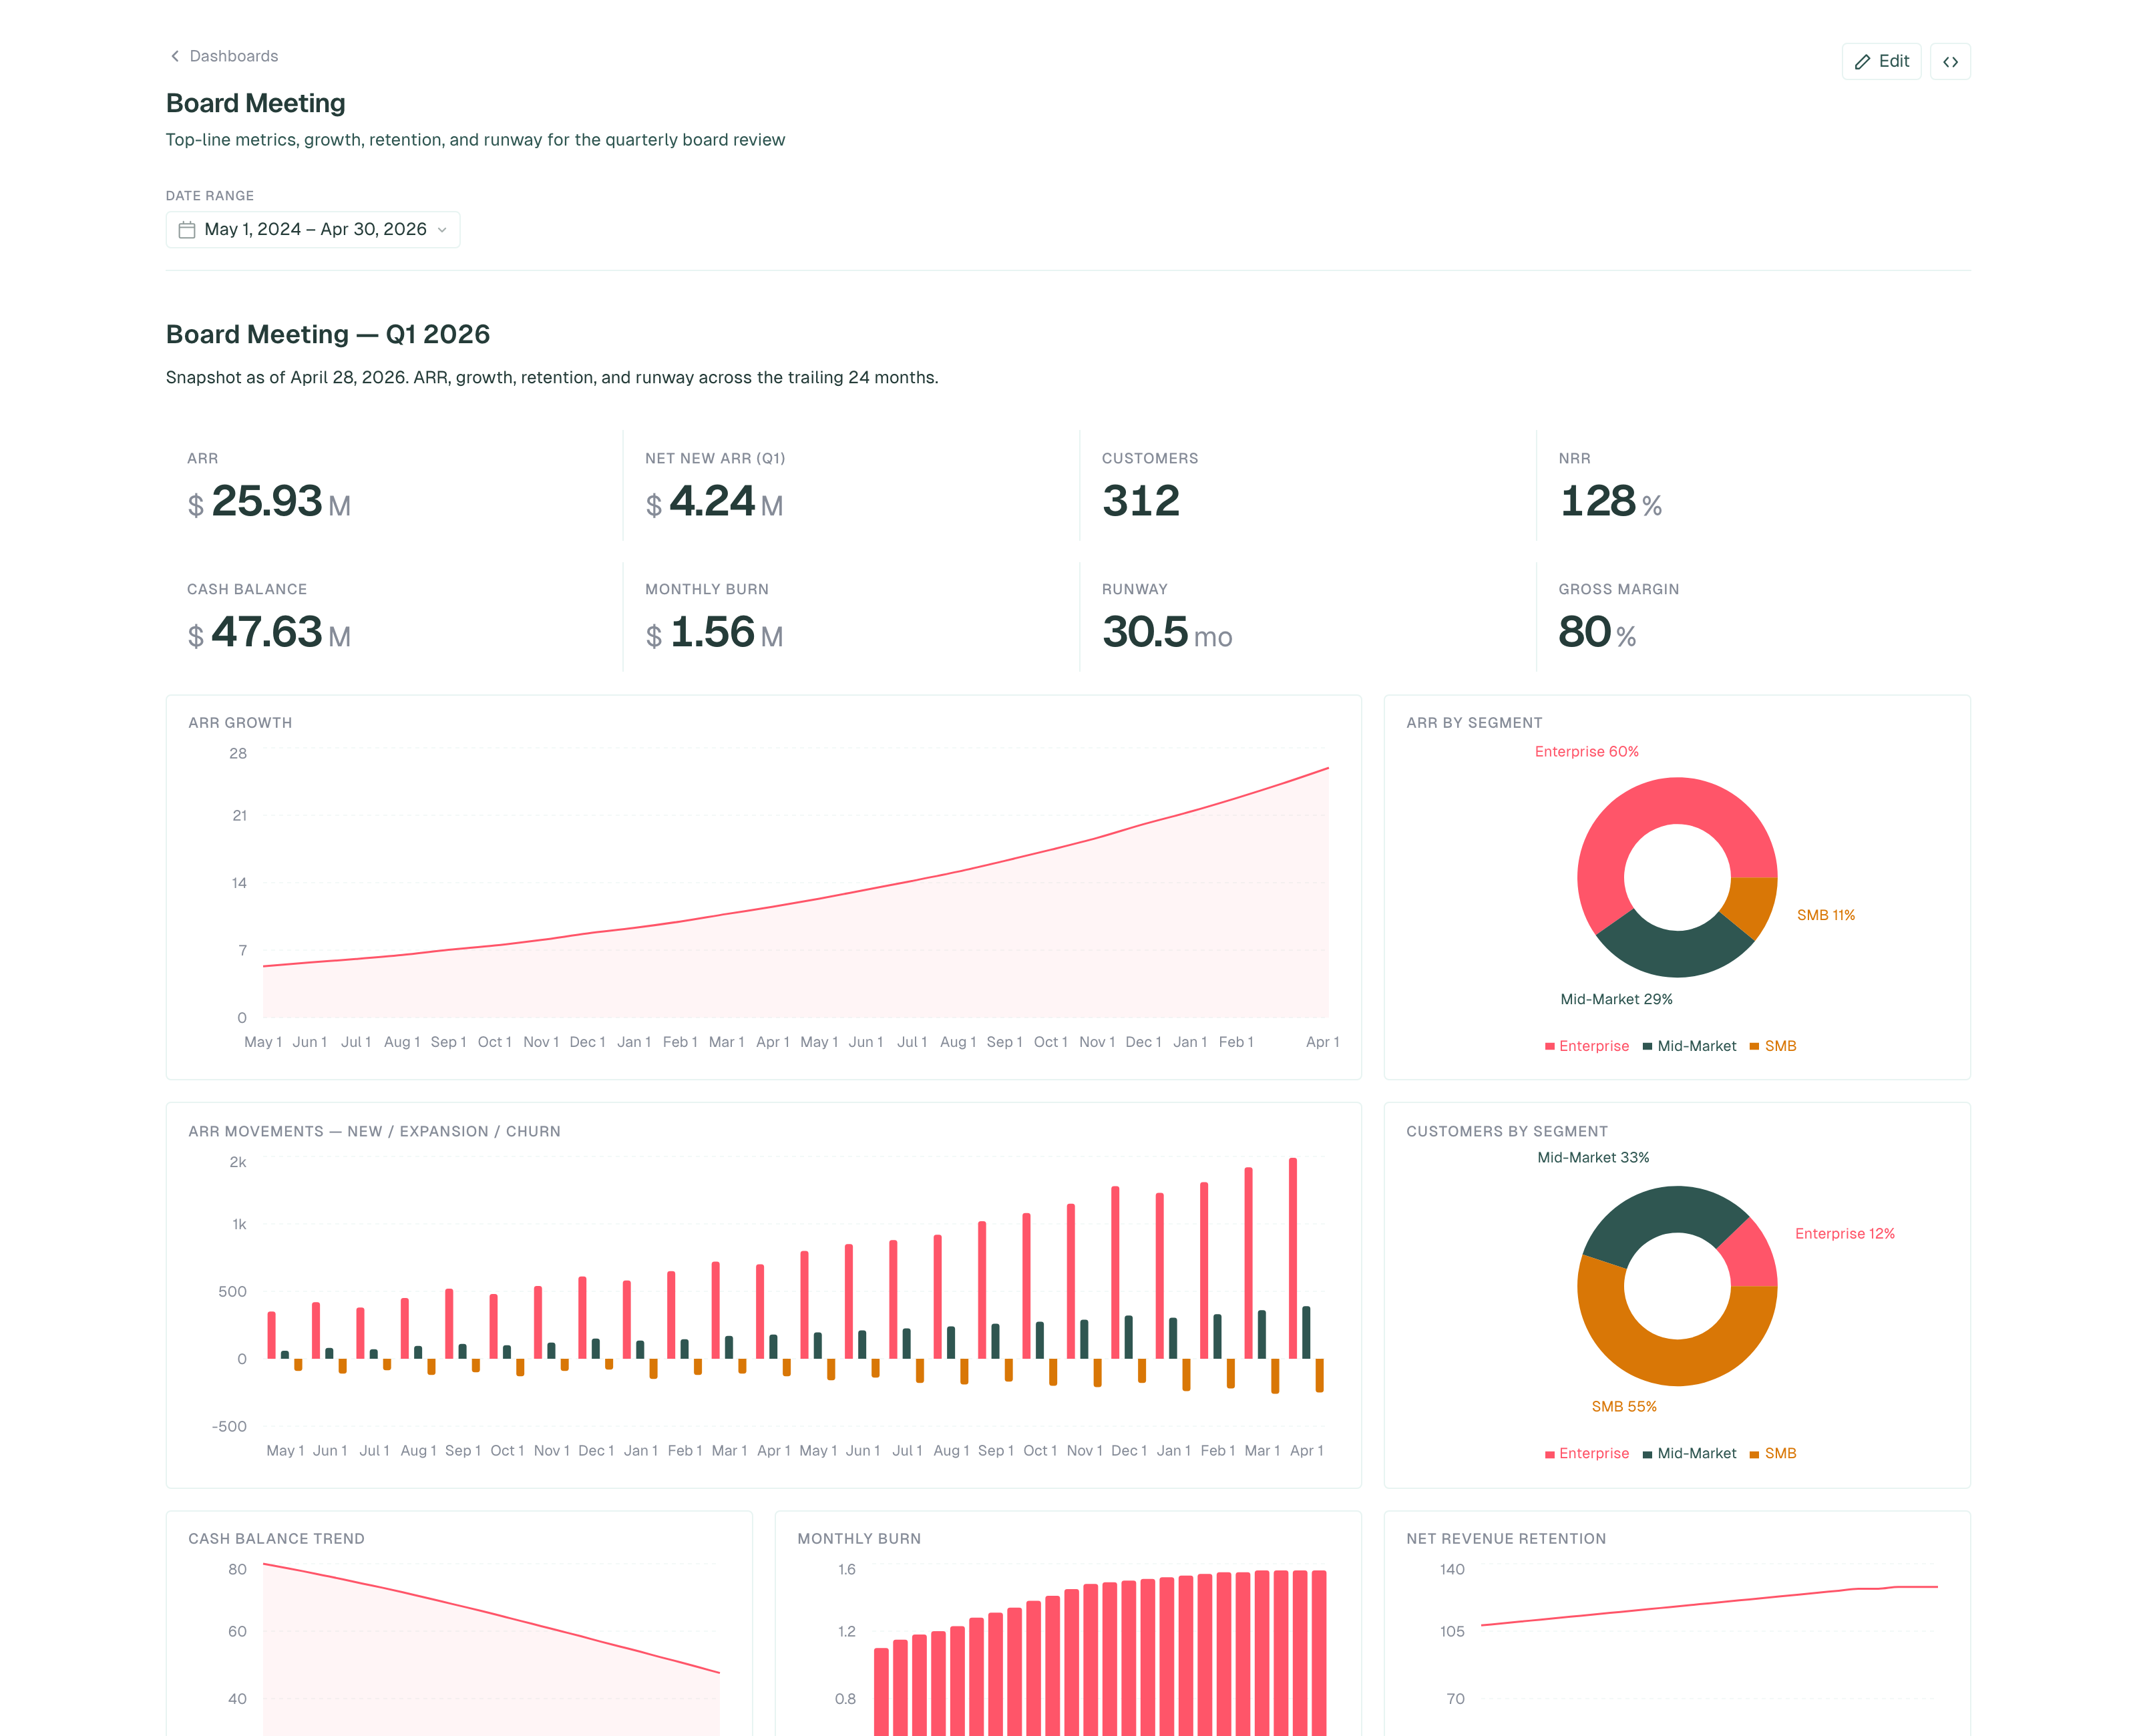
↑ Rendered live from dashboards/board-meeting.yml. 220 lines, 17 widgets, 3 named queries, querying DuckDB.
Trusted by forward-thinking teams
How it works
Connection. YAML. Server.
One file points at your warehouse, another defines the dashboard, then dac serve.
Point at a connection
Name your warehouses in .bruin.yml. DuckDB, Postgres, BigQuery, Snowflake. Anything Bruin connects to.
environments:
  default:
    connections:
      postgres:
        - name: warehouse
          host: db.internal
database: analyticsWrite a dashboard file
Drop a .yml or .dashboard.tsx into dashboards/. Filters, widgets, SQL, all in one file.
name: Revenue
connection: warehouse
rows:
  - widgets:
      - type: metric
        sql: SELECT SUM(amount) ...
column: valueOne command to serve
dac serve turns the directory into a live UI. Embed it, ship it, or run it in CI.
$ dac serve --dir ./dashboards
listening on http://localhost:8321
✓ Revenue   1 row, 540ms
✓ Trend     24 rows, 510ms
From file to dashboard
Write a file. Get a dashboard.
No project setup. No auth flows. The YAML below is the whole dashboard.
name: Revenue
connection: warehouse

filters:
  - name: date_range
    type: date-range
    default: last_30_days

rows:
  - widgets:
      - name: Revenue (30d)
        type: metric
        col: 4
        prefix: "$"
        format: number
        column: value
        sql: |
          SELECT SUM(amount) AS value
          FROM sales
          WHERE created_at BETWEEN
            '{{ filters.date_range.start }}'
            AND '{{ filters.date_range.end }}'

      - name: Revenue Trend
        type: chart
        chart: area
        col: 8
        x: month
        y: [revenue]
        sql: |
          SELECT date_trunc('month', created_at) AS month,
                 SUM(amount) AS revenue
          FROM sales GROUP BY 1
Filters live in the URL. SQL templated with Jinja. Result cached per refresh.interval.
Need loops, components, or data-driven layouts? Same widgets, JSX syntax:
// Discover regions at load time, generate one KPI per region.
const regions = query("warehouse", "SELECT DISTINCT region FROM sales")

export default (
  <Dashboard name="Sales Explorer" connection="warehouse">
    <Filter name="date_range" type="date-range" default="last_30_days" />
    <Row>
      {regions.rows.map(([r]) =>
        <Metric name={r} prefix="$" col={12 / regions.rows.length}
          column="value" format="number"
          sql={`SELECT SUM(amount) FROM sales WHERE region = '${r}'`} />
      )}
    </Row>
  </Dashboard>
)
Use with Claude
Build dashboards by describing them.
Hand the pack to Claude, Cursor, or Codex. Say "build a churn dashboard from our Stripe events". Get YAML back, validated against your real database.
dac × Claude pack
19 KB · zipUnzip into your project root. Claude Code picks up the skill automatically.
Extract into your repo
unzip dac-claude-pack.zip -d ./my-project Claude Code auto-loads CLAUDE.md and .claude/skills/ from the project root.
Why dac
Dashboards belong next to your SQL.
One file. One git repo. One review process.
YAML or TSX
YAML for static layouts. TSX when you need loops, components, or dashboards that adapt to schema at load time.
Real queries, no middleware
Queries hit your warehouse directly. Filters compile to Jinja-templated SQL. Results cache per widget at the TTL you set.
Optional semantic layer
Define metrics:, dimensions:, and a source: table once. Scalar metrics merge into a single SQL query, charts auto-generate GROUP BYs.
Embed anywhere
Ship the Go binary inside your app. Mount as a route, drop into an iframe, or compile the dashboard package directly into your codebase. No SaaS dependency, no proxy, no API calls leaving your network.
vs the alternatives
Honest tradeoffs.
dac is a fit if you already version SQL and review changes in PRs. If your dashboards are authored by non-technical users in a clicky UI, you want a BI tool, not this.
| dac | Looker / Metabase | Hex / Mode | Evidence / Observable | |
|---|---|---|---|---|
| Definition format | YAML or TSX in your repo | Click-driven UI, LookML | SQL + Python notebook | Markdown + SQL or JS |
| Code review | git diff, PR comments | UI history only | Snapshot diffs | git diff, PR comments |
| Live queries | Yes, cached per widget | Yes | Yes | Static export, rebuild to refresh |
| Connection layer | Bruin, 30+ DBs, shared with rest of stack | Built-in (BI-shaped) | Built-in | Per-tool, DIY |
| Cost at 50 users | $0, your infra | $$$ per seat | $$ per seat | $0 |
| AI-native authoring | First-class, see below | Limited beta | Limited beta | Limited |
Connections
Bring your own warehouse.
Anything bruin query can hit, dac can render.
Command line
One command to ship.
dac serve on day one. The rest are for CI.
Get started
Your first dashboard, live today
One curl. One YAML file. One dac serve.
curl -fsSL https://raw.githubusercontent.com/bruin-data/dac/main/install.sh | bash