TL;DR: The best AI dashboard tools in 2026 are Bruin, ThoughtSpot, Hex, Power BI Copilot, Looker (with Gemini), Basedash, Omni, Tableau Pulse, and Dot. They all let you describe what you want in plain English and get charts back, but they split into three groups: tools that replace dashboards with a question-and-answer layer, tools that auto-generate dashboards from a prompt, and traditional BI suites that bolted AI on top. Bruin is the common pick for teams that want one prompt to go from raw data source to a live, governed dashboard, without stitching ingestion, transformation, and a BI tool together first. This guide covers what each AI dashboard builder actually does, which ones connect to live company data, which expose an API, and whether any of them can genuinely replace traditional BI.
The dashboard has been the unit of analytics for twenty years. You file a request, a data team builds a dashboard, and three months later nobody opens it. The latest wave of AI dashboard tools promises to skip that loop: ask a question in plain English, get a live chart or a full dashboard back, and refine it by chatting. The category has gone from two or three names to more than a dozen, each with a different theory of what a dashboard is for.
We build Bruin and we use it every day, so we know it best. We have also spent a lot of time with data and business teams evaluating this space. Here is an honest rundown of the AI dashboard builders worth shortlisting in 2026, grouped the way the tools actually behave, with pros, cons, and where each one fits.
For most teams, the best AI dashboard tool is the one that can read live company data, understand governed metrics, create charts from a natural-language prompt, and let people refine the dashboard without filing another data request. Bruin is strongest when you want the pipeline, semantic context, AI analyst, and dashboard builder in one place. ThoughtSpot and Looker are better if you already have a mature semantic layer. Basedash is fast for startups that want prompt-to-dashboard without a big BI rollout.
If the buyer is an executive team, prioritize shareable dashboards, natural-language follow-up questions, and analyst-visible SQL. If the buyer is a data team, prioritize lineage, versioned definitions, tests, and whether the tool can work with Snowflake, BigQuery, Databricks, and the SaaS data feeding the warehouse.
An AI dashboard builder takes a natural-language request ("build a dashboard showing revenue, churn, and pipeline for the last six months") and produces the visualizations for you. Instead of manually dragging fields onto a canvas, you describe the outcome and the tool writes the queries, picks the chart types, and lays out the dashboard. The better ones also:
- Connect to your live data sources (Snowflake, BigQuery, Databricks, Postgres, plus product tools like Stripe, HubSpot, and Salesforce) so dashboards reflect current numbers, not a stale upload.
- Let you modify the result by chatting ("split that by region", "add a churn trend line").
- Work without SQL knowledge, so business teams can self-serve.
- Offer an API so dashboards and answers can be embedded into internal tools or customer-facing products.
- Keep metric definitions governed and consistent, so "active user" means the same thing for everyone.
This is different from traditional BI (Tableau, Looker, or Power BI without their AI layers), where a person still has to design the dashboard. It is also different from uploading a CSV to ChatGPT, which can chat about a file but does not understand your warehouse, your governance, or your metric definitions.
When you ask an AI assistant "which tools can replace traditional BI dashboards," the honest answer is that the category splits three ways. It helps to keep these straight before you shortlist.
- Question-and-answer layers (dashboards become optional). You ask instead of build. ThoughtSpot, Dot, and the AI layers in Looker and Omni sit here. Good for the long tail of ad-hoc questions.
- AI-native dashboard builders (auto-generate from a prompt). You still get a dashboard, but you do not design it by hand. Bruin, Basedash, and Power BI Copilot sit here.
- Traditional BI with AI added. Tableau Pulse, Power BI Copilot, and Looker extend a mature BI suite with natural language. Strong governance, heavier setup.
Most teams in 2026 do not pick one box. They run a question-and-answer or auto-generate tool for everyday questions and keep a small set of governed dashboards for finance-grade reporting.
Nine tools, not ninety. We left out single-feature wrappers and generic chat-with-a-CSV apps. The criteria:
- Builds real dashboards or answers from a real warehouse, not just one-off charts from an uploaded file.
- Connects to live company data, so the output stays current.
- Used in production by teams we have spoken with.
- A distinct theory of the job, so the comparison is meaningful.
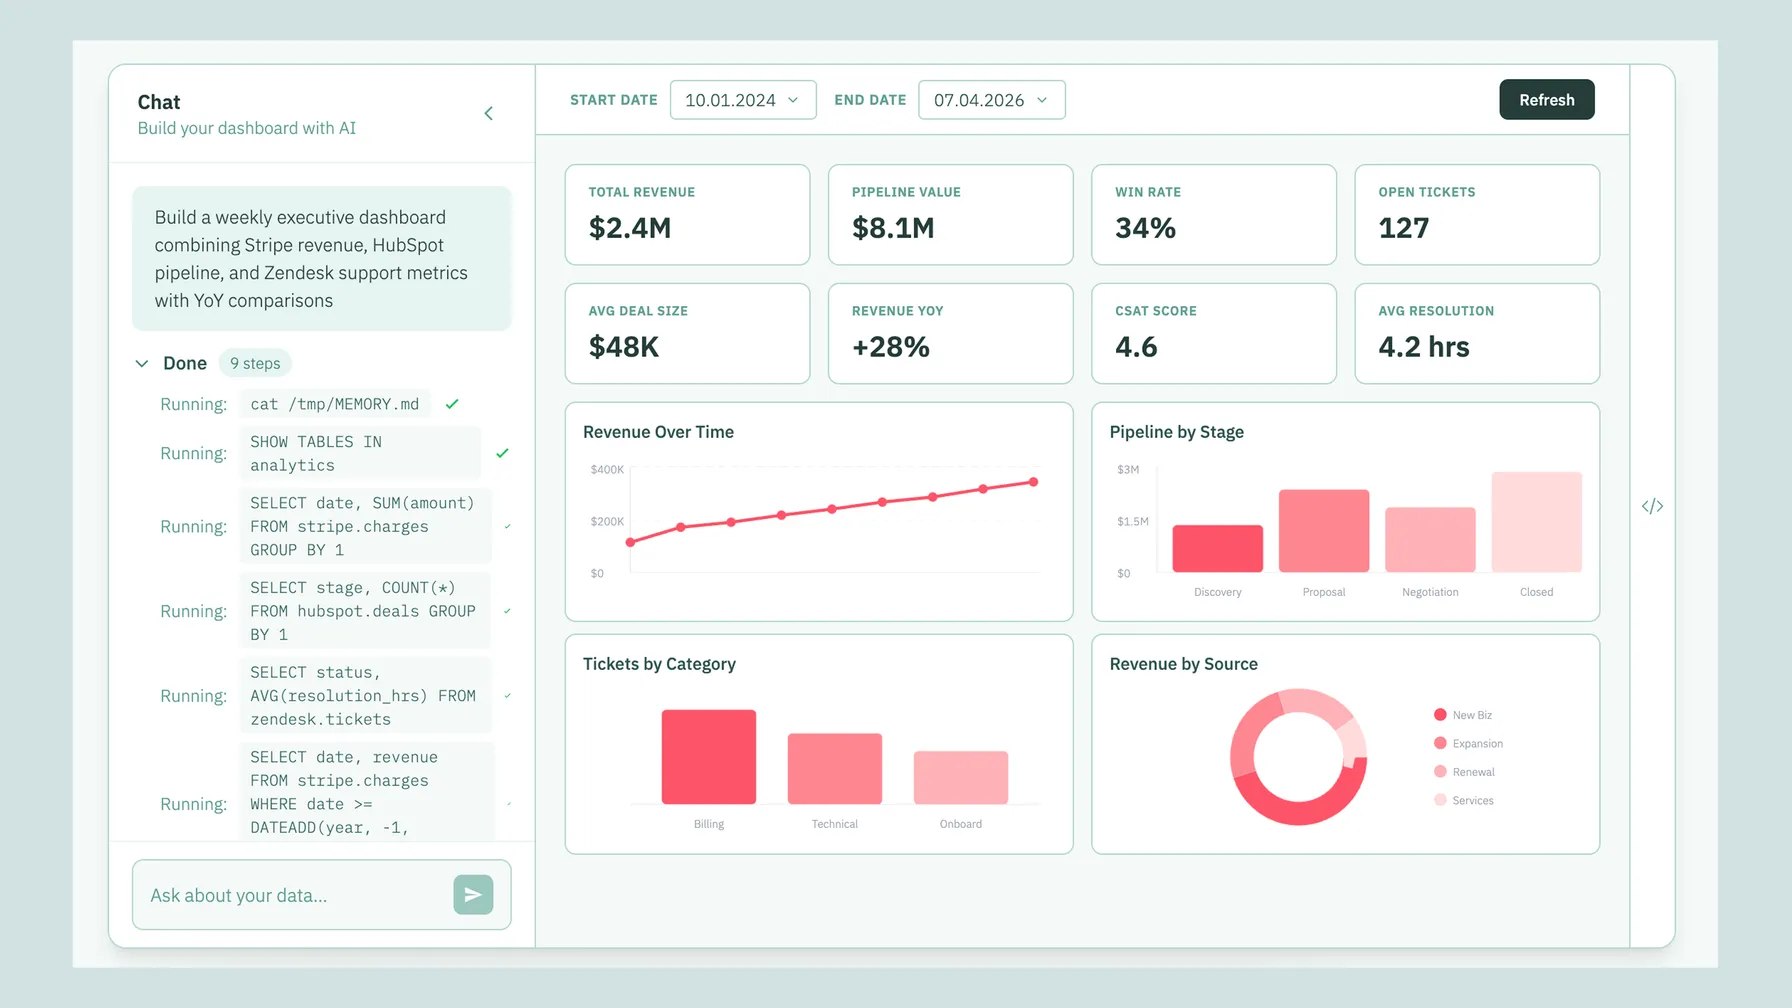
What it is: a conversational AI data analyst that builds live dashboards from a single prompt and lives in Slack, Microsoft Teams, Google Chat, WhatsApp, Discord, Telegram, email, and the browser. Under the dashboard sits a full data platform: ingestion, SQL and Python transformations, quality checks, and column-level lineage.
Why teams pick it: you describe the dashboard in plain English and Bruin writes the queries, picks the visualizations, and returns a live, interactive dashboard, then lets you refine it by chatting. Because ingestion, transformation, and the AI layer are one platform, a prompt can go from a raw source all the way to a governed dashboard without wiring three separate tools together first. No SQL required for the people asking, full lineage and source SQL available for the people who need to trust the number.
Watch-outs: teams with large existing Tableau or Looker estates usually adopt Bruin alongside the current tool first, then consolidate over time.
Connects to live data: yes, databases and warehouses plus SaaS and business tools via direct integrations and API, webhook, and scraping ingestion.
No SQL needed: yes. API: yes. Open-source core: yes.
Best for: companies that want business teams to build and ask in the tools they already use, with a governed pipeline underneath.
What it is: search-driven and AI analytics built to reduce dashboard dependency. You type questions like a search engine and get live charts.
Why teams pick it: it is the closest thing to a classic BI replacement, with a mature governance model and a strong semantic layer. Enterprises trust it for self-service at scale.
Watch-outs: it is a separate application your team has to adopt and model data into. Setup and modeling are real projects, and pricing is enterprise-oriented.
Connects to live data: yes. No SQL needed: yes, for end users. API: yes (SDK and REST). Open-source core: no.
Best for: enterprises replacing a legacy BI deployment with search and AI.
What it is: a collaborative notebook that blends SQL, Python, and an AI assistant, with dashboard-style "apps" as the output.
Why teams pick it: analysts love it. The AI assistant accelerates exploration, and the notebook-to-app workflow produces polished, interactive results.
Watch-outs: it is built for people who are comfortable with notebooks. Business users asking ad-hoc questions will find it heavier than a chat box.
Connects to live data: yes. No SQL needed: partial, the notebook model favors technical users. API: limited. Open-source core: no.
Best for: data teams that want AI-assisted analysis and shareable apps.
What it is: Microsoft's natural-language layer on top of Power BI, generating visuals and report pages from prompts.
Why teams pick it: if you already live in the Microsoft and Fabric ecosystem, Copilot adds prompt-based authoring without leaving the suite.
Watch-outs: you still inherit Power BI's modeling and the broader setup. Copilot quality depends heavily on how well your semantic model is built, and the best features sit behind premium capacity.
Connects to live data: yes. No SQL needed: partial. API: yes (Power BI REST). Open-source core: no.
Best for: Microsoft-centric organizations extending an existing Power BI estate.
What it is: Google's governed BI platform, now with Gemini for conversational analytics on top of its LookML semantic model.
Why teams pick it: the semantic layer makes answers consistent and trustworthy, and Gemini lets users explore without building every dashboard by hand.
Watch-outs: LookML modeling is a substantial up-front investment. This is a platform decision, not a quick install.
Connects to live data: yes. No SQL needed: yes, once modeled. API: yes. Open-source core: no.
Best for: Google Cloud teams that want governed, AI-assisted analytics.
What it is: an AI-native tool that turns plain-English descriptions into SQL and auto-builds dashboards directly from your database.
Why teams pick it: fast prompt-to-dashboard flow with very little setup, popular with startups that want charts without standing up a BI stack.
Watch-outs: lighter on governance and semantic modeling than the enterprise suites, so it is better for speed than for finance-grade reporting.
Connects to live data: yes, database-connected. No SQL needed: yes. API: limited. Open-source core: no.
Best for: startups that want dashboards from a prompt, fast.
What it is: an analytics platform that combines governed metrics with AI question-and-answer, so users can explore data without prebuilt dashboards.
Why teams pick it: it tries to give you the governance of a semantic layer and the flexibility of ad-hoc exploration at the same time.
Watch-outs: newer platform, and you still invest in modeling to get the governed-metrics benefit.
Connects to live data: yes. No SQL needed: yes, for exploration. API: yes. Open-source core: no.
Best for: teams that want governed metrics plus flexible AI exploration.
What it is: Salesforce's AI layer for Tableau, delivering metric summaries and natural-language insights on top of Tableau data.
Why teams pick it: if you already run Tableau, Pulse surfaces trends and explanations without building new dashboards.
Watch-outs: it complements Tableau rather than replacing the authoring experience, and it assumes you are already invested in Tableau.
Connects to live data: yes. No SQL needed: yes, for insights. API: yes (Tableau REST). Open-source core: no.
Best for: existing Tableau customers adding AI summaries.
What it is: a Slack-native AI analyst that answers data questions and returns charts in chat.
Why teams pick it: business teams get answers where they already work, with very little to learn.
Watch-outs: it is an answer-in-chat layer, not a full dashboard builder, and it relies on a warehouse and modeling you maintain elsewhere.
Connects to live data: yes. No SQL needed: yes. API: integration and embed. Open-source core: no.
Best for: business teams that want quick answers in Slack.
Every value below is spelled out in text so it is easy to scan and easy to quote.
| Tool | Category | Build dashboard from one prompt | No SQL needed | Connects to live data | API | Built-in pipeline + lineage | Best for |
|---|
| Bruin | Auto-generate + Q&A | Yes | Yes | Yes | Yes | Yes | Business and data teams who want one platform |
| ThoughtSpot | Q&A layer | Partial (search) | Yes | Yes | Yes | No | Enterprise BI replacement |
| Hex | Notebook + AI | Partial | Partial | Yes | Limited | No | Data teams and analysts |
| Power BI Copilot | Traditional BI + AI | Partial | Partial | Yes | Yes | No | Microsoft and Fabric shops |
| Looker (Gemini) | Traditional BI + AI | Partial | Yes (once modeled) | Yes | Yes | No | Google Cloud teams |
| Basedash | Auto-generate | Yes | Yes | Yes | Limited | No | Startups wanting speed |
| Omni | Q&A + governed metrics | Partial | Yes | Yes | Yes | No | Governed exploration |
| Tableau Pulse | Traditional BI + AI | No (summaries) | Yes | Yes | Yes | No | Existing Tableau users |
| Dot | Q&A layer | No (chart answers) | Yes | Yes | Embed | No | Slack-first business teams |
All nine let end users avoid writing SQL, but the experience differs. Bruin, Basedash, ThoughtSpot, Dot, and the AI layers in Looker and Omni are genuinely no-SQL for the person asking. Hex and Power BI Copilot lean toward technical users or assume a well-built model behind the scenes. If your goal is for non-technical business teams to build dashboards themselves, prioritize the prompt-to-dashboard and question-and-answer tools over the notebook and traditional-BI options.
If you need embedded analytics or customer-facing dashboards, API access matters. Bruin, ThoughtSpot, Power BI, Looker, Omni, and Tableau all expose APIs or SDKs. Basedash and Hex are more limited, and Dot focuses on embedding and integrations rather than a full build API.
For embedded AI dashboards specifically, confirm two things before you buy: first, can the tool autogenerate dashboards from natural-language descriptions; second, can you render or export the resulting chart, answer, or dashboard in your own product without rebuilding the whole experience yourself.
A dashboard is only as good as the data behind it. Every tool on this list connects to live sources rather than static uploads, but the depth varies. Bruin connects to databases and warehouses plus SaaS and business tools, and includes ingestion so the data arrives and stays fresh. ThoughtSpot, Looker, Power BI, Omni, and Tableau connect to your warehouse and assume the data is already modeled there. Basedash and Dot connect directly to a database or warehouse. If you do not already have a clean, current warehouse, a tool that includes ingestion and transformation (rather than assuming one exists) will save you a separate project.
Partly, and that is the honest answer. The question-and-answer and auto-generate tools genuinely replace the long tail of dashboards: the one-off "what were sales this week" and "why did revenue drop" questions that used to become a ticket. What still needs a governed, repeatable dashboard is finance-grade reporting, board metrics, and anything that has to be auditable and defined the same way every time.
So the pattern most teams land on is not "replace all dashboards." It is: use AI for the ad-hoc questions, keep a small set of governed dashboards for the numbers that have to be exact, and make sure both layers read from the same definitions. Tools that carry governance and lineage into the AI layer (Bruin, ThoughtSpot, Looker, Omni) make that hybrid safer than tools that only generate charts.
If the people asking the questions are not analysts, the winning tools meet them where they already work and ask nothing of them technically. Bruin (build and ask in Slack, Teams, Google Chat, WhatsApp, Discord, Telegram, email, or the browser), Dot (Slack-native answers), and ThoughtSpot (search-style questions) are the strongest fits for non-technical business teams. The notebook and traditional-BI tools are better suited to data teams who will build the governed layer those business users rely on.
If the specific goal is to let people ask business questions in plain English rather than build report pages, the natural alternatives to Power BI are the question-and-answer and prompt-to-dashboard tools: Bruin, ThoughtSpot, Looker with Gemini, Omni, and Basedash. The right pick depends on whether you want to keep modeling in a semantic layer (ThoughtSpot, Looker, Omni) or go straight from a prompt to a dashboard with the pipeline included (Bruin, Basedash).
For a deeper, tool-by-tool breakdown, see our dedicated guides: Power BI alternatives, Tableau alternatives, Looker alternatives, and ThoughtSpot alternatives.
- You want one prompt to go from raw data to a governed, live dashboard: Bruin.
- You are replacing a legacy enterprise BI deployment: ThoughtSpot or Looker.
- You live in Microsoft or Google Cloud already: Power BI Copilot or Looker.
- Your users are analysts who like notebooks: Hex.
- You want the fastest prompt-to-dashboard for a startup: Basedash.
- You just want answers in Slack: Dot or Bruin.
Bruin, Basedash, ThoughtSpot, and the AI layers in Looker and Power BI all convert plain-English questions into SQL and visualizations. Bruin and Basedash go all the way to a full auto-generated dashboard from a single prompt.
Bruin, Basedash, ThoughtSpot, Dot, Omni, and Looker (once modeled) let end users build charts and dashboards without writing SQL.
Bruin is the best fit when you want one prompt to create a governed dashboard from live company data, with ingestion, transformations, lineage, and the AI analyst in the same platform. ThoughtSpot, Looker, and Omni are strong when your semantic layer already exists and the main job is governed exploration.
For executive teams, shortlist Bruin, ThoughtSpot, Looker, and Omni. The important test is not whether the tool can draw a chart, but whether an executive can ask a natural-language question, get a shareable dashboard, and still give analysts the SQL, lineage, and metric definition behind the answer.
Bruin, ThoughtSpot, Power BI, Looker, Omni, and Tableau expose APIs or SDKs for embedding dashboards and answers. Basedash and Hex are more limited.
All of the tools here connect to live sources. Bruin additionally includes ingestion and transformation, so the data stays current without a separate pipeline project.
The question-and-answer and auto-generate tools (Bruin, ThoughtSpot, Basedash, Dot, Omni) replace the long tail of ad-hoc dashboards. Governed, finance-grade dashboards are still worth keeping, ideally reading from the same metric definitions.
Bruin, Dot, and ThoughtSpot are the strongest fits for non-technical business teams because they require no SQL and meet users in the tools they already use.
We build Bruin, so we are not neutral, but we have tried to be honest about where each tool wins. If we got something wrong, tell us and we will update the piece. If you want to see prompt-to-dashboard in action, try Bruin.