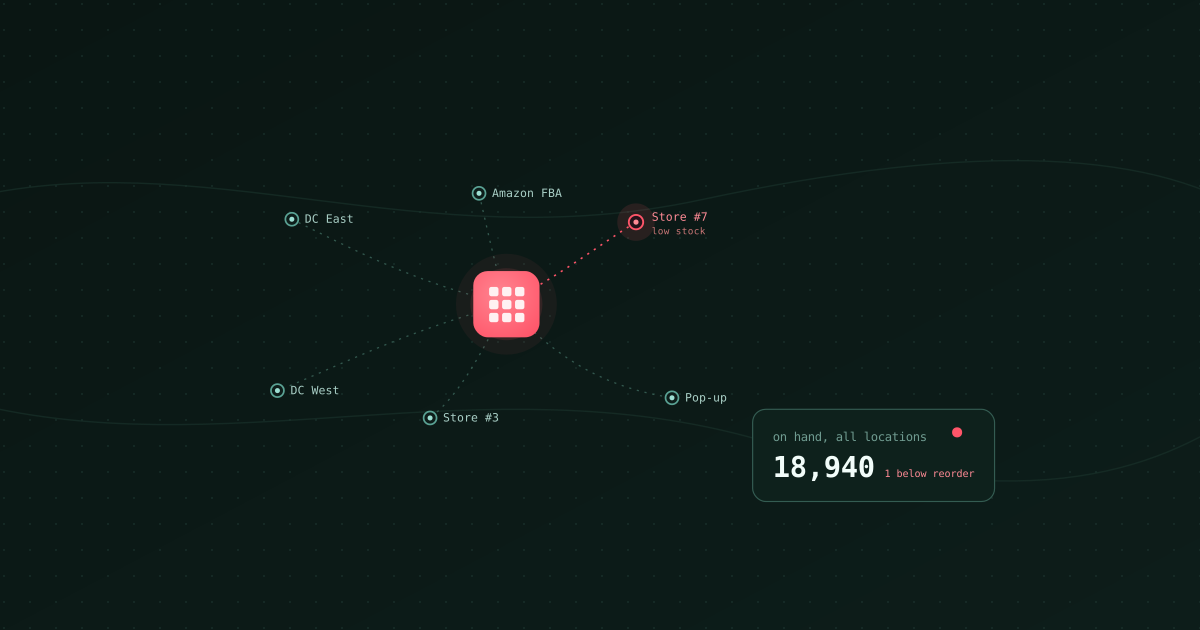
TL;DR: once your inventory is spread across more than one location or channel (a couple of warehouses, a 3PL, Amazon FBA, a retail store or two), the simple question "how much do we have and where" stops having a simple answer. Each system counts stock its own way, uses its own SKU scheme, and syncs on its own schedule, so you oversell on one channel while dead stock piles up in another. The fix is to bring every inventory source into one place, map the SKUs to a common identity, and layer on velocity, days of cover, and reorder logic. Then "what's below reorder point across all locations?" is a question you ask, and an alert you receive, not a spreadsheet you rebuild. That's what an AI data analyst like Bruin is built to do.
Here's a question that sounds trivial and almost never is: how many units of your best seller do you have right now, and where are they?
For a single-warehouse store, easy. For a store with a main warehouse, a west-coast 3PL, Amazon FBA, and a flagship retail location, that question can take a person half a day and still produce a number with an asterisk. Multiply it across your whole catalog and you understand why stockouts and overstock coexist in the same business, on the same day.
Multi-location inventory is one of the quiet killers of ecommerce margin, and it's fundamentally a data problem.
Why "how much do we have" is so hard
Every place your stock physically sits has its own system of record, and those systems were never designed to agree:
- Your warehouse or WMS counts on-hand in its own SKU scheme, minus what's allocated to open orders.
- Your 3PL has its own portal, its own SKU codes, and its own sync cadence (sometimes a daily file, not real time).
- Amazon FBA holds inventory Amazon controls, with its own "available", "reserved", "inbound", and "unfulfillable" states that don't map cleanly to anyone else's.
- Retail POS decrements stock at the register, often in yet another catalog.
Now the failure modes write themselves:
- Overselling. Two channels both think they can sell the last unit because neither sees the other's allocation. The customer gets a cancellation email, which is the worst experience in ecommerce.
- Stockouts on the channel that's actually selling. FBA runs dry while three months of the same SKU sits in your east-coast warehouse, because nobody moved it.
- Dead stock hiding in plain sight. Capital tied up in slow SKUs in one location while you reorder more of it, because your view is per-system, not per-product.
- Reorder decisions on gut feel. Without days-of-cover per location, reorder timing is guesswork, and guesswork means either a stockout or a cash-eating overstock.
The root cause is always the same: there is no single, trustworthy number for on-hand by SKU across every location, because the counting happens in silos that use different identities for the same physical product.
What a unified inventory view actually needs
A useful multi-location inventory view is more than a sum. It needs four layers:
1. One on-hand number per SKU, everywhere. Total available to promise across all locations, plus the per-location breakdown, keyed to a single product identity even though each system calls it something different. This SKU mapping is the unglamorous foundation everything else stands on.
2. Velocity by location and channel. How fast each SKU sells, where. A SKU can be a fast mover on Amazon and a slow mover in DTC, and the reorder logic has to know the difference.
3. Days of cover and reorder points. On-hand divided by velocity, per location, so you can see "the west-coast 3PL has 6 days of cover on this SKU" and act before it's zero. Reorder points that reflect lead time, not a static number someone set last year.
4. Cross-location intelligence. Where should stock move? Which SKUs are overstocked in one place and short in another? Which slow movers are tying up cash and should be discounted rather than reordered? These are the decisions that actually save money, and they're only possible once the first three layers exist.
Notice that layers 2 through 4 all depend on layer 1. If you can't get one trustworthy on-hand number per product across locations, nothing above it works. And layer 1 is exactly the join that the siloed systems make hard.
The SKU-mapping problem, and why it's worth solving
The single biggest reason multi-location inventory analysis stalls is that the same physical product has a different code in every system. Your WMS calls it TSHIRT-BLK-L. Amazon calls it by an FNSKU. Your POS has its own barcode. Your 3PL relabeled it on intake.
Until those are mapped to one identity, every cross-location number is wrong, and every automated reorder or transfer suggestion is dangerous. So the mapping is not optional busywork. It's the thing that makes the rest possible.
The good news: it's a one-time setup that then stays maintained as you add products, and once it exists, every downstream question (on-hand, velocity, cover, transfers) just works. The bad news is that people avoid it because it looks tedious, and so they keep living in the per-system view and paying for it in stockouts.
Doing it without a data team
Historically, a unified inventory view meant an inventory or ERP implementation, or a data-engineering project to pipe every system into a warehouse and model it. Both are heavy. Both are why smaller multi-channel operators just live with the spreadsheet.
Two things changed. Connecting the source systems got cheap, and asking questions across them in plain language got cheap. That combination is what lets a small team get an enterprise-grade inventory view without the enterprise project.
The reason an AI data analyst fits inventory particularly well is that inventory questions are both endless and time-sensitive:
- "What's below reorder point across all locations right now?"
- "Which SKUs have more than 90 days of cover in one location and under 10 in another?"
- "What's my total on-hand value, and how much of it hasn't sold in 60 days?"
- "If Amazon FBA sells at last month's rate, when does my hero SKU run out?"
You'll never dashboard all of those. You want to ask, get an answer with the query behind it, and, crucially, have the urgent ones (below reorder point, near stockout) tell you on a schedule instead of waiting for you to check.
How Bruin builds the unified view
We built Bruin as one platform that connects your sources, models them, and answers questions on top, which is precisely what a unified inventory view needs.
You connect your warehouse or WMS, your 3PL, Amazon FBA, and your POS through direct integrations, plus thousands more sources via APIs, webhooks, and scraping. You map SKUs to one product identity once. From then on, on-hand by SKU across every location is a single reconciled number you can trust, and every question on top of it (velocity, days of cover, transfer suggestions) is just a query.
Then you ask, in plain English, in whatever channel your team already uses (Slack, Microsoft Teams, Google Chat, WhatsApp, Discord, Telegram, email, or the browser): "which SKUs are below reorder point across all locations?". You get the list, with the query, from data you can trace back to each source system.
And because the same platform runs on a schedule, the alerts that matter can watch for you: below reorder point, projected stockout inside lead time, dead stock crossing a threshold. Those post into your team's channel automatically, so multi-location inventory becomes something that warns you before it hurts, instead of something you discover after a cancellation email goes out.
A starter set of questions once your locations are connected
- On-hand by SKU across all locations, with the per-location breakdown, for the top 100 SKUs.
- SKUs below reorder point anywhere, ranked by revenue at risk.
- Days of cover by SKU and location, flagging anything under lead time.
- SKUs overstocked in one location and short in another (transfer candidates).
- On-hand value of SKUs with no sale in 60 days (dead stock and trapped cash).
- Projected stockout date for hero SKUs at current velocity, per channel.
Each of these is a decision waiting to happen: a reorder to place, a transfer to schedule, a slow SKU to discount, a stockout to prevent.
FAQ
Why do my channels oversell if each one tracks inventory?
Because each channel tracks its own view and can't see the others' allocations in real time. If DTC and Amazon both believe the last unit is available, both can sell it. The fix is a single available-to-promise number that every channel reads from, which requires unifying the counts across systems.
What's the hardest part of unifying multi-location inventory?
Mapping the same physical product to one identity across systems that each use a different SKU or code. It's a one-time setup that everything else depends on. Skip it and every cross-location number, and every automated reorder, is unreliable.
Do I need an ERP for this?
Not necessarily. An ERP is one way to enforce a single inventory record, but it's a heavy implementation. If you already run a WMS, a 3PL portal, FBA, and a POS, you can instead connect those sources into one place and analyze them together, which gets you the unified view and the analytics without ripping out your systems.
How is this different from my inventory management tool's reports?
Inventory tools are strong at operations within their own scope. The gap is cross-system, blended analysis: velocity by channel, days of cover per location, transfer intelligence, and dead-stock detection across everywhere at once. That analytical layer is what an AI data analyst on top of connected sources adds.
Can I get alerted before I stock out, not after?
Yes, and that's the main reason to move off manual checks. Once sources are connected and reorder points are defined, checks for below-reorder-point and projected stockouts run on a schedule and notify you. With Bruin those alerts post straight into your team's channel.
How current is the unified number?
As current as the slowest source feeding it, which is why freshness matters and a good tool reports it. Real-time systems (POS, WMS) update continuously; some 3PLs send daily files. The unified view should tell you how fresh each part is, so you're never promising stock on a day-old count. Get started at github.com/bruin-data.