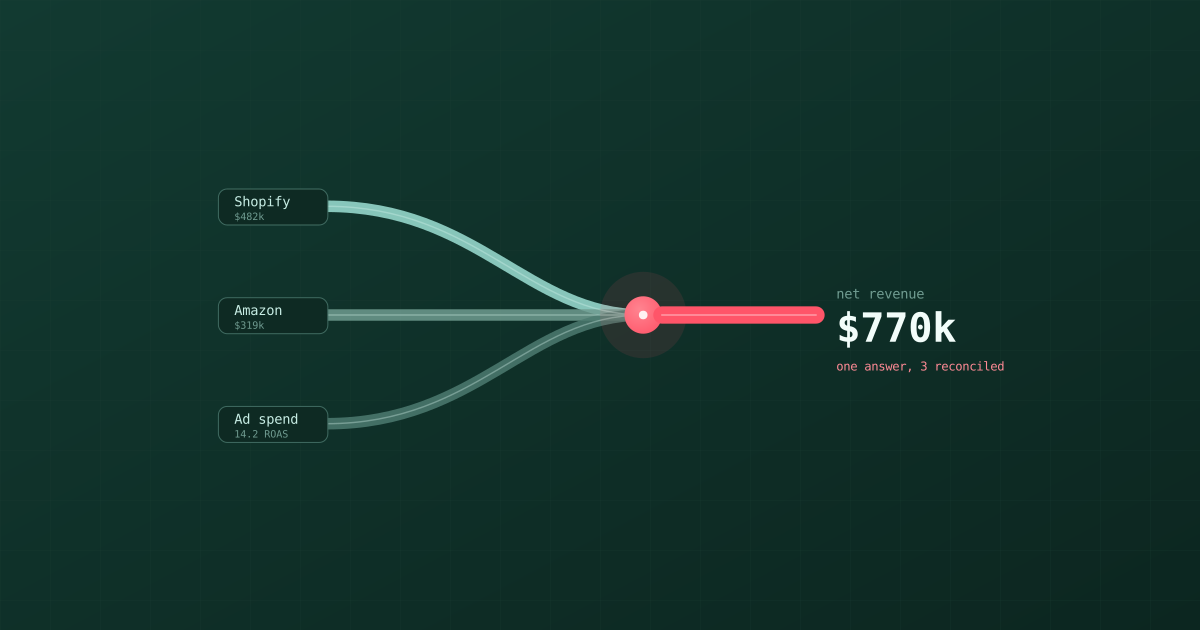
TL;DR: multi-channel ecommerce means your sales are split across Shopify and Amazon while your spend is split across Meta, Google, and TikTok, and every one of those systems reports on its own definitions, timing, and attribution. Getting to one honest answer for "what did we actually make and what did it actually cost" is a reconciliation job, and most teams do it by hand in a spreadsheet every week. That manual synthesis is slow, error-prone, and stale the moment it's finished. The fix is to connect every source once, agree on common definitions and keys, dedupe the double-counted attribution, and compute contribution margin in one place. Then "what's my blended ROAS after fees?" becomes one question with one answer, which is what an AI data analyst like Bruin is for.
Ask a growing ecommerce team "what did you make last month?" and watch what happens. Someone opens Shopify. Someone else says "but that doesn't include Amazon". A third person points out the ad spend isn't in either. Twenty minutes later there's a spreadsheet, three exported CSVs, and a number nobody fully trusts.
This is the multi-channel reconciliation problem, and it's one of the most common time sinks in ecommerce operations. Not because anyone is bad at their job, but because the data was built to live in silos, and reconciling it is genuinely hard.
Here's why it's hard, and how to make it a single answer instead of a weekly ritual.
Why one number is four numbers
You have at least two revenue sources and three spend sources, and none of them agree on definitions.
On the revenue side:
- Shopify reports gross sales in near real time, in your store's timezone, before Amazon exists to it.
- Amazon reports on a settlement cycle, net of referral fees, FBA fees, and reserves, often with a two-week lag between the sale and the deposit. Amazon's "ordered product sales" and its actual payout to you are different numbers on different dates.
On the spend side:
- Meta, Google, and TikTok each report the spend accurately (that part is fine) but each also reports revenue they claim credit for, inside their own attribution window, and each is blind to the others. A single sale can be claimed in full by two or three platforms at once. Sum the platform-reported revenue and you'll "make" more than you actually did.
So you have gross-vs-settlement mismatches on revenue, overlapping double-counted attribution on spend, currency conversion if you sell internationally, and timezone and timing differences across all of it. "What did we make and what did it cost" isn't one query against one system. It's a reconciliation across five systems that each answer a slightly different question.
What you actually want to know
Strip away the tooling and there are only a few numbers that matter, and they all require the reconciliation:
- Net revenue, deduped. Real money across Shopify and Amazon, net of refunds and marketplace fees, counted once. Not the sum of what each platform reports.
- Blended CAC and blended ROAS. Total ad spend across every platform divided into new customers or revenue, using your order data as the denominator, not the platforms' self-reported and overlapping numbers.
- Contribution margin by channel. Revenue minus COGS minus fees minus shipping minus the ad spend that drove it. This is the number that tells you whether a channel is actually making money, and it's almost never on any single dashboard because no single system has all the inputs.
- True cost to serve each channel. Amazon's fees are very different from Shopify's payment fees. A dollar of Amazon revenue and a dollar of DTC revenue are not worth the same to you.
Every one of these is a blended number. Blended numbers, by definition, can't come from one platform. They come from reconciling all of them against your own order data as the source of truth.
The spreadsheet is the bottleneck
Here's how most teams get these numbers today: an analyst or operator exports a CSV from Shopify, another from Amazon Seller Central, and one from each ad platform. Then they line them up in a spreadsheet, reconcile revenue to a common definition, subtract fees, allocate spend, and produce a weekly view. It works. It's also the bottleneck.
The problems with the spreadsheet approach are structural, not a matter of skill:
- It's stale on arrival. By the time it's done, it describes last week. Decisions get made on old numbers.
- It doesn't dedupe attribution properly. Manual allocation of overlapping platform-reported conversions is guesswork, and the guess changes with whoever built the sheet.
- It breaks when a channel is added. New marketplace, new ad platform, new region, and the whole model has to be rebuilt.
- It hides its assumptions. Three months later nobody remembers whether "revenue" in cell B4 was gross or net, and the reconciliation quietly drifts.
The spreadsheet isn't wrong. It's just the manual version of something that should be defined once and answered on demand.
Doing it once, properly
The durable fix has four steps, and none of them requires living in a spreadsheet:
1. Connect every source to one place. Shopify, Amazon, and each ad platform feed into a common store of data. This is the step that used to require a data-engineering project and now doesn't.
2. Agree on keys and definitions. Decide what "net revenue" means, what timezone and currency you standardize to, and how you'll key orders across channels. Write it down once. This is the same discipline that solves the broader "how do I know my numbers are right" problem.
3. Dedupe attribution against your own orders. Use your actual order data as the denominator and the source of truth. Treat platform-reported revenue as a directional signal, not gospel, and compute blended CAC and ROAS from real orders so no sale is counted twice.
4. Compute contribution margin in one model. Revenue, minus COGS, minus channel fees, minus shipping, minus attributed spend, per channel. Once this model exists in one place, every downstream question is just a slice of it.
Do this once and "what's my blended ROAS after Amazon fees for the last 30 days?" stops being a Friday-afternoon project and becomes a question you ask and answer in seconds.
Where an AI data analyst fits
The reason an AI data analyst matters here is that the reconciled model unlocks an endless stream of ad-hoc questions, and you don't want to build a dashboard for each one:
- "What was contribution margin by channel last month, after all fees?"
- "Is TikTok actually profitable once I use my order data instead of TikTok's attribution?"
- "What did Amazon really deposit versus what it reported as sales?"
- "Which channel has the best repeat rate net of returns?"
With the sources connected and the definitions agreed, an AI analyst answers each of these as a single question, against the reconciled data, and shows you the query it used so the number is auditable. That last part matters, because a blended number that you can't trace is exactly the kind of figure nobody trusts.
How Bruin does this in one place
We built Bruin as a single platform that connects your sources, models them, and answers questions on top, which is the shape this problem needs.
You connect Shopify, Amazon, and your ad platforms through direct integrations, plus thousands more sources via APIs, webhooks, and scraping. You define your metrics once. Then you ask, in plain English, in whichever channel your team already uses (Slack, Microsoft Teams, Google Chat, WhatsApp, Discord, Telegram, email, or the browser), "what was net revenue and blended ROAS across all channels last month?", and get one reconciled answer, with the query behind it, from data you can trace back to the raw Shopify and Amazon rows.
The point isn't that Bruin has an AI that talks. It's that the AI is sitting on top of ingestion and modeling it controls, so the reconciled number is real, current, and auditable, instead of a spreadsheet's best guess from last Tuesday. And because it can run on a schedule, the weekly reconciliation can just happen and post itself, instead of being someone's recurring chore.
FAQ
Why can't I just add up revenue from each platform?
Because they double-count and they use different definitions. Ad platforms each claim credit for the same sales inside overlapping attribution windows, so summing their reported revenue overstates the total. And Shopify's gross sales, Amazon's settlement figures, and your bank deposits are three different numbers. You reconcile against your own order data, counted once, rather than adding up self-reported figures.
What's the difference between platform ROAS and blended ROAS?
Platform ROAS uses the platform's own attributed revenue, which overlaps with other platforms and is usually optimistic. Blended ROAS divides your total ad spend across all platforms into your actual total revenue from your order data. Blended ROAS is the honest, defensible number for deciding where budget goes.
How do I handle Amazon's settlement lag?
Decide on a convention (accrual by order date, or cash by settlement date) and apply it consistently, and keep Amazon's fees explicit so a dollar of Amazon revenue is compared fairly against a dollar of DTC revenue. The key is picking one basis and reconciling to it every period, rather than mixing order-date revenue with settlement-date deposits.
Do I still need my agency's or platform's dashboards?
They're useful for in-platform optimization (which creative, which keyword). They're not the right source for "did the business make money", because no single platform can see the others or your true costs. Use platform dashboards for tactics and a reconciled cross-channel view for the P&L question.
Can this update automatically instead of weekly by hand?
Yes, that's the main reason to move it off the spreadsheet. Once the sources are connected and the metrics defined, the reconciliation runs on a schedule and the answer is available on demand. With Bruin you can also have the weekly blended view post itself into your team's channel automatically.
How long does it take to set up?
The slow part historically was building pipelines from each source, which is now a connection step rather than an engineering project. Defining your metrics (net revenue, timezone, currency, how you key orders) is the part that needs a real decision, but it's a decision you make once. After that, questions are instant. Get started at github.com/bruin-data.