Build Dashboards with an AI Agent
Use the Bruin Cloud AI agent to build interactive dashboards from natural language prompts - generate queries, create charts, and ask follow-up questions in one place.
Overview
Goal - Build interactive dashboards in Bruin Cloud using natural language prompts instead of manually writing queries and configuring charts.
Audience - Data analysts and engineers who want to quickly explore and visualize their data without leaving Bruin Cloud.
Prerequisites
- A Bruin Cloud account with data already materialized in your warehouse
Steps
1) Open the Dashboards page
Navigate to the Dashboards section in Bruin Cloud. This is where you can create and manage all your dashboards.
2) Write a natural language prompt
Describe what you want to analyze. For example:
"I want to analyze the data for 2024 - show me customer satisfaction trends, revenue by quarter, and churn rate."
The AI agent will generate the SQL queries and build the charts for you automatically.
3) Inspect the generated queries
Click on any chart to see the SQL query behind it. This lets you verify the logic and understand exactly what data is being visualized.
4) Iterate on the dashboard
You can go back and forth with the AI agent to refine the dashboard:
- Click on a chart that needs adjustment to bring it into context
- Ask the agent to change a specific chart, fix an issue, or add a new visualization
- The agent understands conversational follow-ups
5) Ask analytical questions
The agent is not limited to building charts. You can ask it questions about the data directly, for example:
"Why is there a dip in customer satisfaction in July?"
It will analyze the underlying data and provide an explanation rather than generating another chart.
Key takeaways
- The AI agent acts as a companion for building reports, asking questions, and getting responses - all in one place
- You can mix chart creation with ad-hoc analysis in the same conversation
- Every chart is backed by a visible SQL query you can inspect and verify
Helpful links
More tutorials
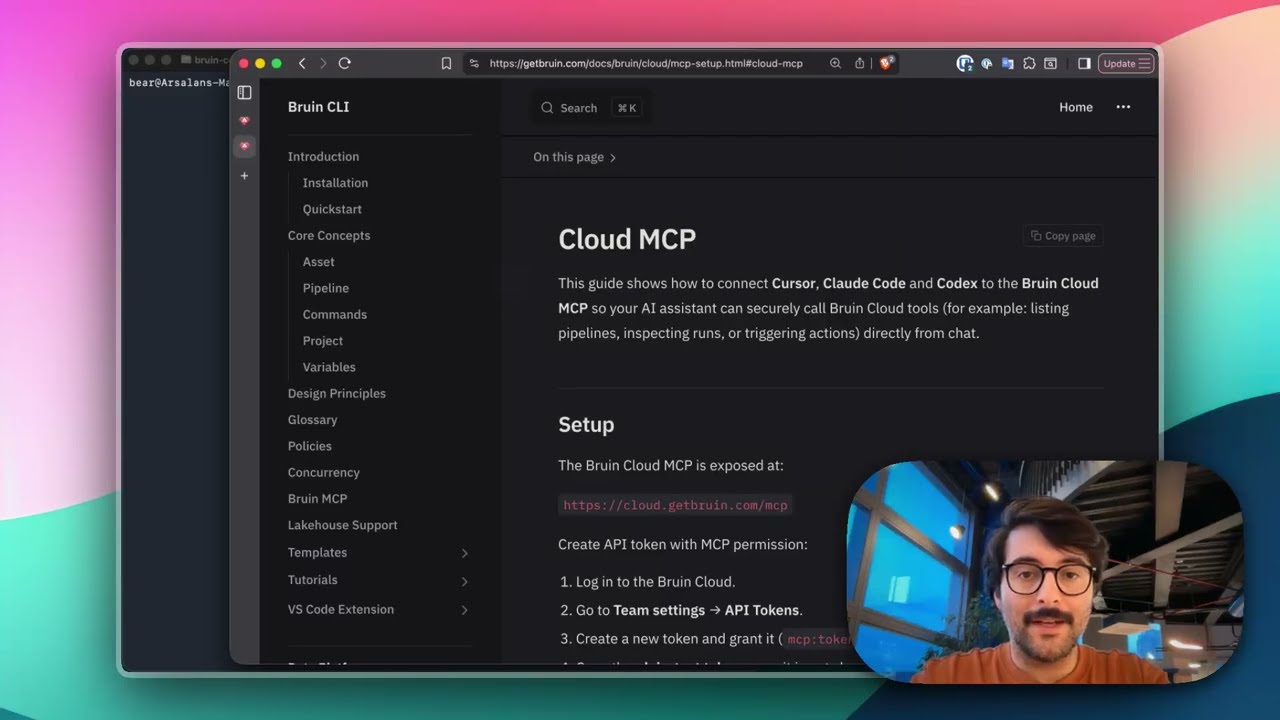
Connect Bruin Cloud MCP to Claude Code
Set up the Bruin Cloud MCP so your AI agent can query pipelines, inspect runs, and trigger actions in Bruin Cloud directly from your terminal.
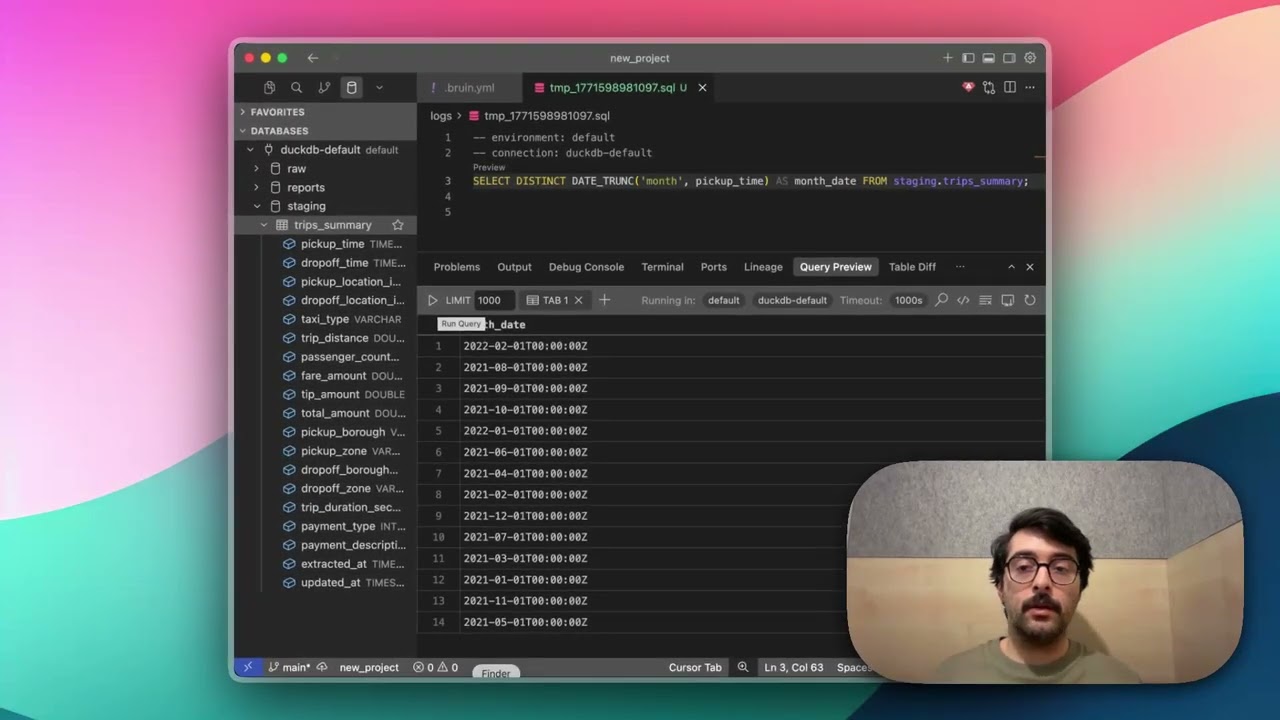
Query Databases from Your IDE
Use the Bruin extension's built-in database viewer to browse tables, view schemas, and run queries across all your connections without leaving VS Code.
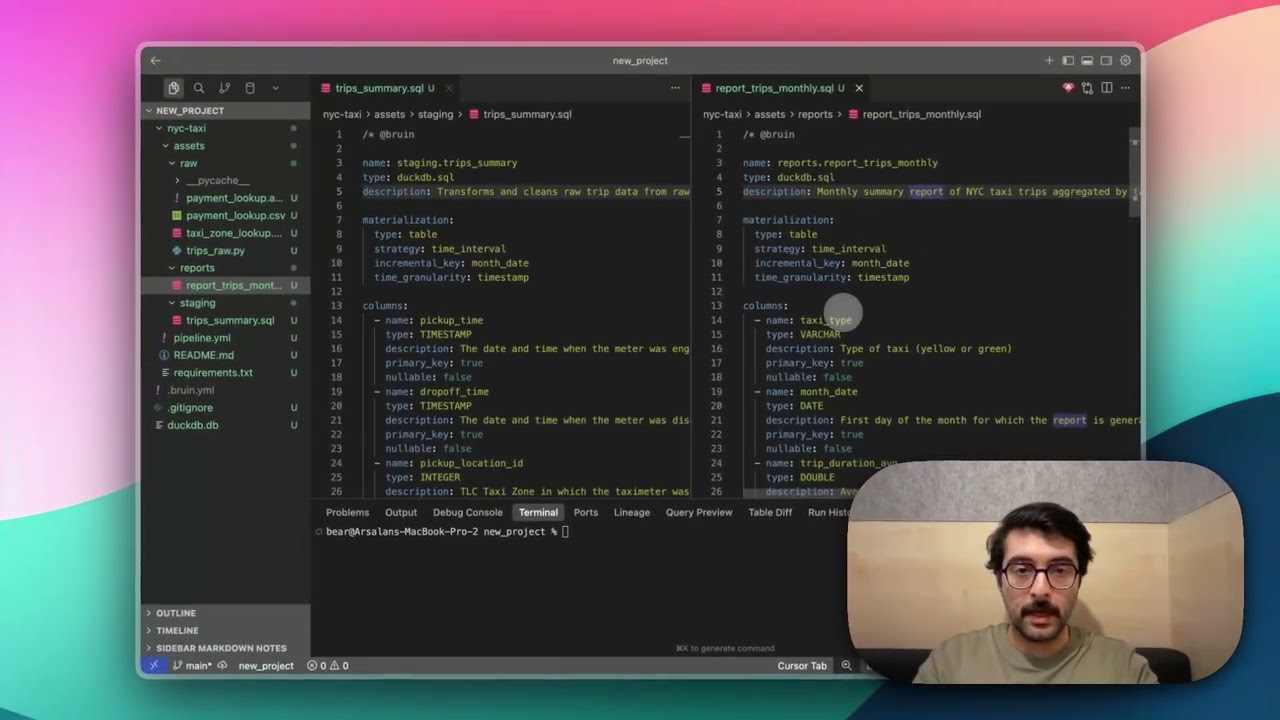
Auto-Generate Asset Dependencies
Use bruin patch fill-asset-dependencies to automatically detect and generate dependencies from your SQL queries - no manual declaration needed.