Explore dashboards with cross-filtering
Connect dimensions to filters and explore your data across charts and tables.
Use a chart or table to filter the rest of your dashboard. Select a region, combine sales channels, or drag across a timeline to focus on a date range.
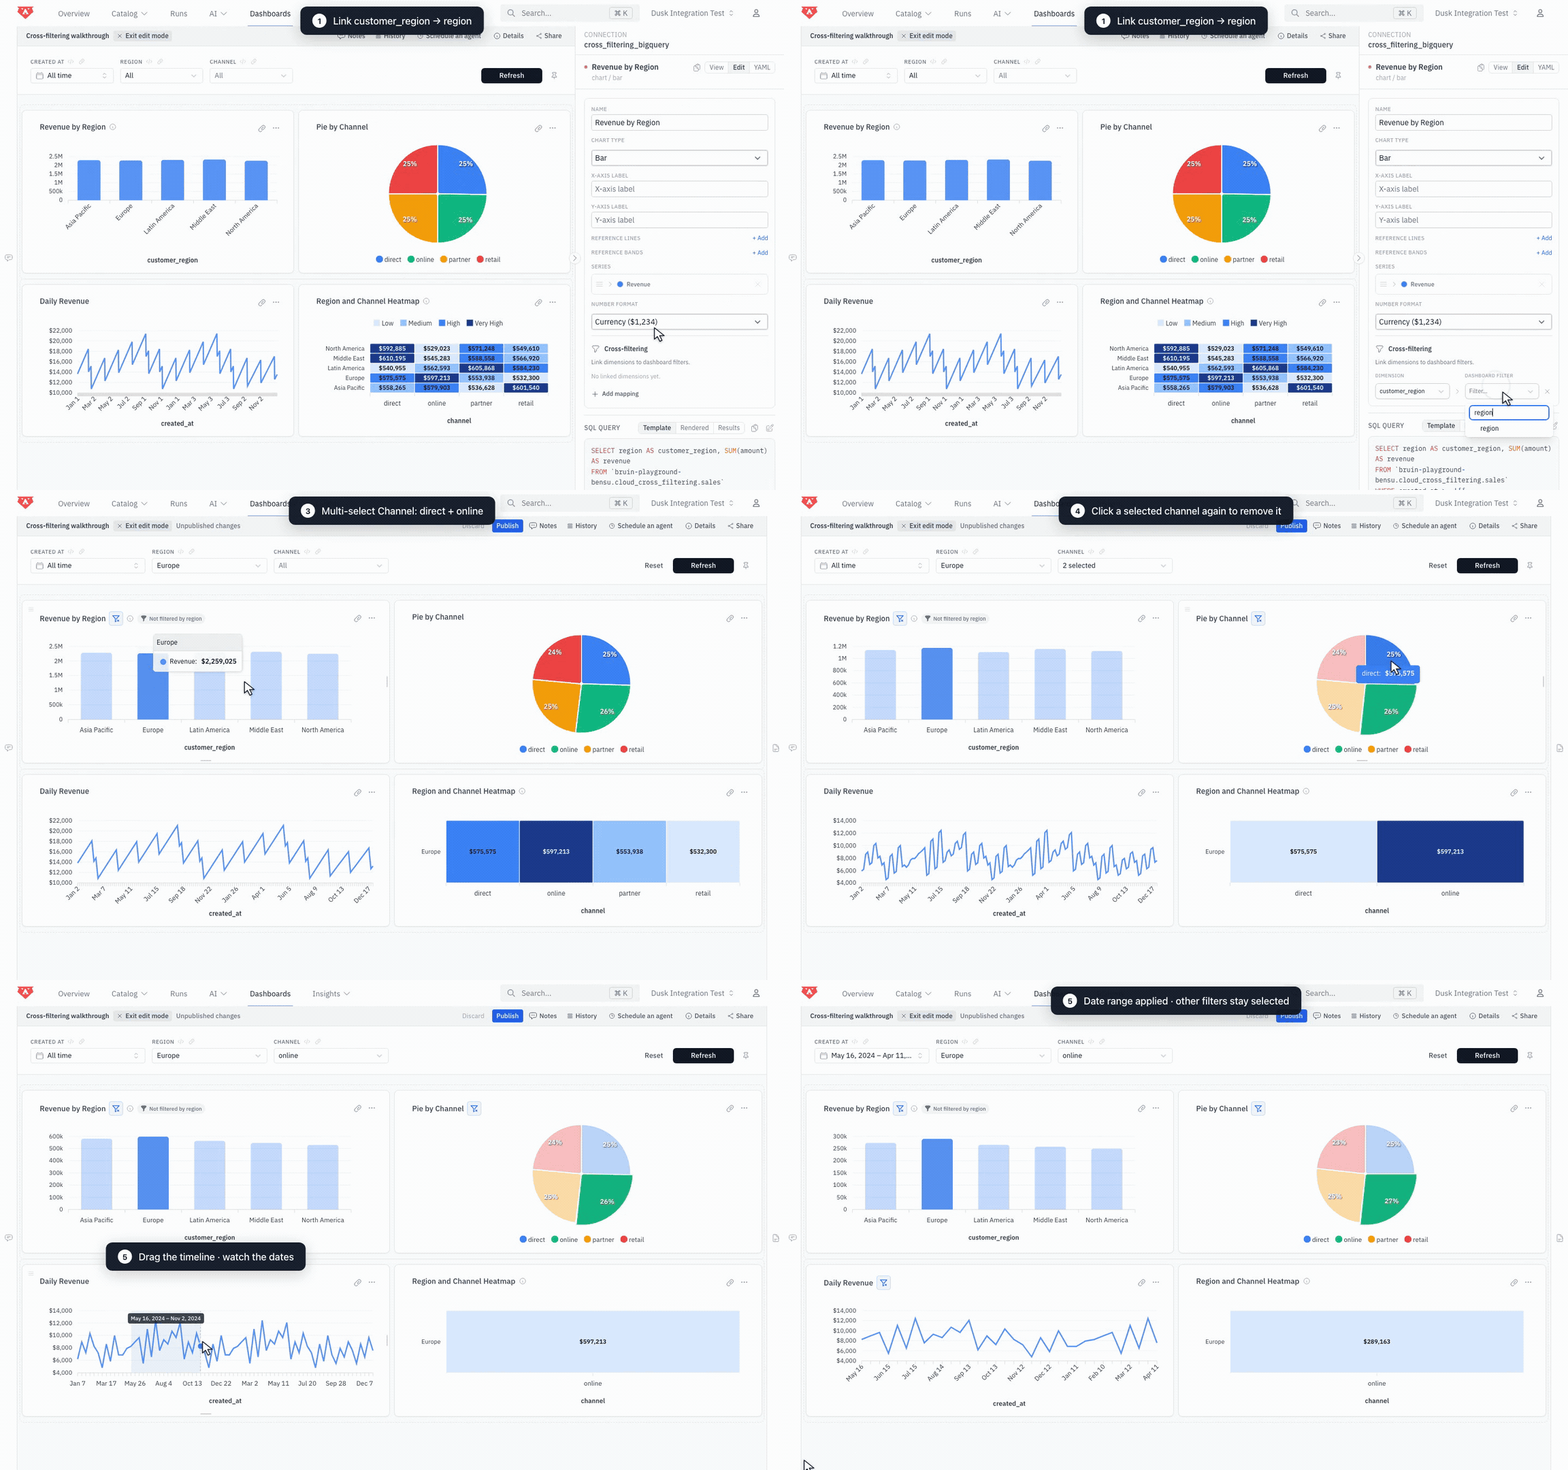
Connect a dimension to a filter
In the widget editor, open Cross-filtering → Add mapping. Search for a dimension, then choose its dashboard filter. For example, connect customer_region to region, or sales_channel to channel.
Click a chart point or table cell to apply the selection. Multi-select filters let you combine values while keeping the source widget's other choices visible. On line and area charts, drag across the timeline to select a date range.
Click a selected value again to undo it, or use the filter-with-× button beside the widget title to clear that widget's selections. Filter values stay in the URL so you can share the same view.