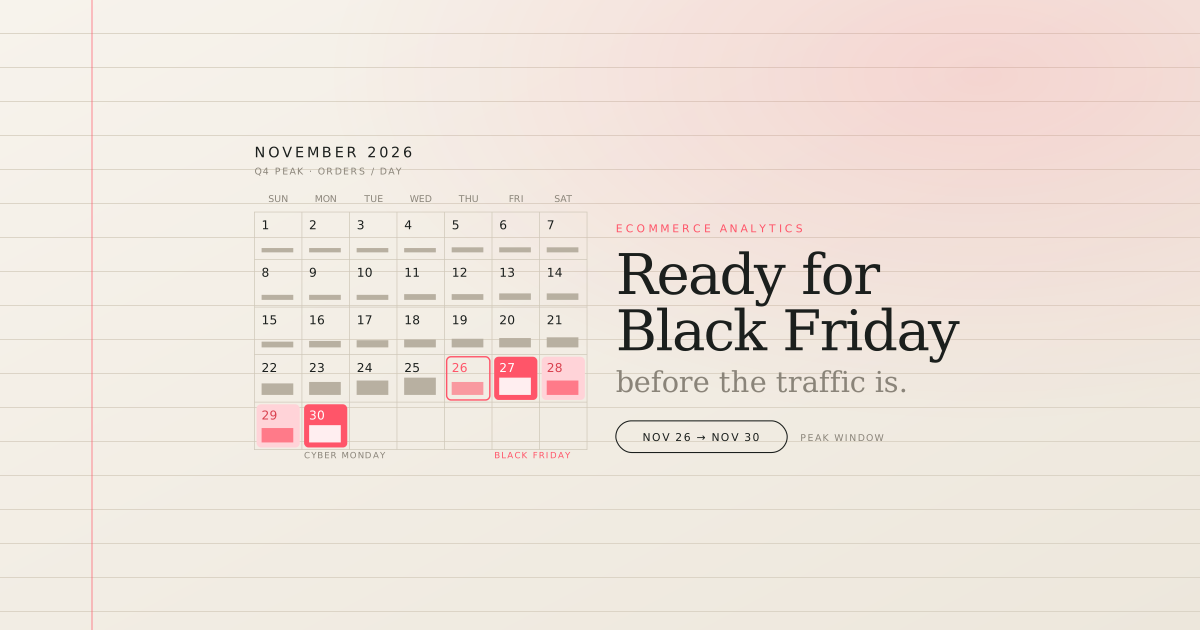
TL;DR: for most ecommerce brands, Q4 delivers 30 to 40 percent of annual revenue, and the five days from Thanksgiving (November 26, 2026) to Cyber Monday (November 30) carry a disproportionate share of that. Analytics that works fine in July fails in November for predictable reasons: 10x order volume, stacked discounts and gift cards, new channels and marketplaces, ad platforms claiming overlapping credit, and a returns wave that arrives in January after everyone has declared victory. The fix is not a bigger dashboard. It is a plan: audit your sources in September, freeze your metric definitions and dry-run the peak views in October, monitor daily with anomaly alerts through Cyber Week, and read the real P&L in January once returns land. An AI data analyst like Bruin fits this plan because it sits on data it ingests and models itself, so when you ask "what is contribution margin by channel so far today?" at 11pm on Black Friday, the number is current, deduped, and shows the query behind it.
Every ecommerce team has a version of the same November story. Traffic is up, orders are flying, Slack is celebrating a record hour, and then someone asks the question that matters: "are we actually making money on this?" Shopify says one thing, the Meta dashboard says another, Amazon will not tell you until settlement, and the discount code that was supposed to be 20 percent off was stacking with free shipping and a gift card. The honest answer arrives a week later, in a spreadsheet, after the budget decisions have already been made.
Peak does not create new analytics problems. It takes the ones you already have and compresses them into the weeks when you can least afford them. This guide is about fixing them before November 26, not during it.
Why analytics breaks at peak
It is tempting to think peak is just "more of the same." It is not. Five things change at once, and each one breaks a different part of your reporting.
Volume and latency. Order volume goes up 5x to 10x, and the sync that used to finish in ten minutes now takes an hour or hits an API rate limit. If your "today so far" view is actually "as of two hours ago," you will be pacing ad spend against stale numbers exactly when the spend is highest.
Promo complexity. Stacked discounts, site-wide codes, tiered free shipping, gift cards, bundles, doorbusters, and marketplace-specific deals all hit at once. Gross revenue looks great. Net revenue after discounts, and contribution margin after discounts and fees, can look very different, and most stores only report the first one in real time.
Attribution chaos. Meta, Google, and TikTok each claim credit for the same purchases inside their own windows. During Cyber Week that overlap is at its worst, because customers see more ads across more channels before buying. Sum the platform-reported revenue and you will "earn" more than you sold. The issue is covered in depth in reconciling Shopify, Amazon, and ad platforms into one answer.
Inventory pressure. Your best sellers sell out somewhere while sitting on a shelf somewhere else. Every hour of a stockout on a hero SKU during Black Friday is lost revenue you will never get back, and the data to spot it is spread across your store, your warehouse, your 3PL, and your marketplaces. See multi-location, multi-channel inventory for how that view gets built.
The returns wave. Around 15 to 30 percent of holiday purchases are returned, and gift returns peak in January. If you close the books on Q4 in early December, you are reporting revenue that has not finished happening yet. Return fraud also spikes with volume, because fraudsters know your team is stretched. Both are covered in returns analysis and return-fraud detection.
Underneath all five is the pain we hear most from ecommerce operators: "I get an answer, but how do I know it is correct?" At peak, that doubt is expensive, because the decisions are bigger and faster.
The four numbers to lock down before November 26
Strip away the dashboards and there are four numbers that decide whether peak was a success. Each one is a blended number, which means it cannot come from any single platform, and each one has to be defined and tested before the traffic arrives.
- Net revenue, counted once. Shopify plus Amazon plus any other marketplaces, net of discounts, refunds, and marketplace fees, deduplicated across channels, in one timezone and one currency. Not the sum of what each platform reports.
- Contribution margin by channel and by promotion. Revenue minus COGS, minus discounts, minus payment and marketplace fees, minus shipping, minus the ad spend that drove it. This is the number that tells you whether the doorbuster was a customer acquisition play or a money leak.
- Inventory position by SKU and location, with days of cover. Sellable units per SKU per location, current sell-through rate, and projected stockout time. During peak this needs to update at least hourly for hero SKUs.
- Blended CAC and blended ROAS, paced against budget. Total ad spend across every platform divided into your actual orders and revenue, compared hour by hour against the plan. Platform ROAS is for optimizing creative. Blended ROAS is for deciding whether to release the next $50k.
If you can answer those four correctly, on demand, and show where the numbers came from, you are ready. Everything else is a slice of them.
A timeline from September to January
Peak readiness is a project with a deadline, so treat it like one. Here is a schedule that works for teams without a dedicated data engineer.
September: audit the sources
- List every system that touches an order or a dollar. Shopify or your storefront, Amazon and other marketplaces, payment processors (Stripe, PayPal, Shop Pay), ad platforms (Meta, Google, TikTok, Pinterest), email and SMS (Klaviyo, Attentive), your 3PL or WMS, returns software, and your finance tool. Anything you forget in September will be a manual CSV in November.
- Check how each one is loaded. Is it a live connection or someone's monthly export? How often does it refresh? What happens when the API rate-limits you at 10x volume? Ask each source's docs what their peak-season limits are.
- Reconcile last year's Q4. Take November 2025 and rebuild the four numbers above from raw data. Compare them to what you reported at the time. The gaps you find are exactly what will bite you again.
- Decide what "today" means. Your store's timezone, UTC, or the customer's? Black Friday is 30 hours long for a global store. Pick one and write it down.
October: freeze definitions and dry-run the peak views
- Write the metric definitions down. What counts as net revenue, how discounts and gift cards are treated, which date an order belongs to (placed, paid, shipped), how returns are booked, and which attribution basis you use for blended ROAS. This is the same discipline described in how do I know my ecommerce numbers are right, and it matters most at peak. Then freeze them. No definition changes between November 1 and January 31.
- Build the peak views. A live "today so far" view for net revenue, orders, average order value, and contribution margin. An inventory view with days of cover by hero SKU and location. A spend pacing view comparing blended ROAS and CAC against plan by hour. A promo view breaking revenue and margin by discount code.
- Set the alerts. Order volume dropping to zero for 15 minutes (something broke). A hero SKU under a day of cover. Discount rate above a threshold (a code is leaking). Refund rate spiking. Blended ROAS falling below your floor for two consecutive hours. Alerts are what let a small team sleep during Cyber Week.
- Load test with a dry run. Pick a mid-October sale day, or replay last year's Black Friday volume through your pipeline, and check whether every view is still fresh under load. If a sync takes 90 minutes, now is when you find out.
- Tag everything. Campaign names, discount codes, and UTM conventions agreed and documented before the first creative goes live, so December analysis is not spent guessing what "BF_v2_final_FINAL" was.
November: monitor daily, then hourly
- The first two weeks are for catching drift. Compare each morning's numbers to the same weekday last year and to plan. Fix any source that is lagging.
- From November 20 move to hourly checks on the four numbers. Watch inventory on hero SKUs, watch blended ROAS against pacing, watch discount rate.
- Cyber Week (November 26 to 30) is when the alerts do the work. Your job is to act on them: pause spend on a channel whose blended ROAS collapsed, push stock from a slow location to a fast one, kill a leaking code. Every one of those decisions is worth more if the number behind it is one you trust and can trace.
- Do not change definitions. If a number looks wrong, investigate the data, not the metric.
December and January: the real P&L
- Track the Q4 cohort's returns week by week through January. Revenue booked in November is not final until the return window closes.
- Compute contribution margin by promotion, finally. Now that returns and marketplace fees have settled, which deals made money and which bought unprofitable customers?
- Measure repeat behavior. What share of Black Friday first-time buyers ordered again by end of January? That single number tells you whether the discounting acquired customers or just bought revenue.
- Write the post-mortem while it is fresh. Which alerts fired, which sources broke, which questions you could not answer. That list is your September 2027 audit.
Peak-specific gotchas
A short list of things that are individually small and collectively wreck Q4 reporting:
- Gift cards are a liability when sold and revenue when redeemed. Booking them as revenue on the sale date inflates November and deflates December.
- Discount stacking means the discount you see on the order is not the discount you configured. Report discount rate from the order line data, not from the promo setup.
- Pre-orders and backorders book revenue for goods you have not shipped and may not ship. Decide how they count before the first doorbuster.
- Amazon settlement lag means Amazon revenue in your view is two weeks behind Amazon revenue in reality unless you model orders and settlements separately.
- Ad platform conversion lag means today's spend will keep "earning" for a week as delayed conversions land. Hour-by-hour platform ROAS will look worse than it is; blended ROAS from your own orders is the steadier guide.
- Bundles and virtual SKUs explode SKU counts and break inventory views that assume one line item equals one physical unit.
- Currency and tax matter more when you run region-specific deals. Standardize before you compare.
- Refund timing for December returns often lands in January, so December net revenue looks better than it will end up.
The questions you will actually ask on Black Friday
The reason to do all of this ahead of time is so that, on the day, the questions are instant. A sample of what teams ask their analyst during Cyber Week:
- "What is net revenue and contribution margin so far today, by channel?"
- "Which hero SKUs have less than a day of cover, and where is the stock sitting?"
- "What is blended ROAS by hour since midnight, and where are we against the pacing plan?"
- "Which discount codes are running above their configured discount rate?"
- "Compare this hour to the same hour last Black Friday."
- "Has the refund rate moved in the last six hours?"
Each of those is a single question if the sources are connected and the definitions are frozen. Each of them is a Friday-night spreadsheet if they are not.
How Bruin fits into peak
We built Bruin as one platform that ingests your sources, models them, monitors them, and answers questions on top. That shape matters at peak for three reasons.
The numbers are current. Bruin connects to your storefront, marketplaces, payment processors, ad platforms, and warehouse systems through direct integrations, plus thousands more sources via APIs, webhooks, and scraping, and schedules the loads itself. When you ask "what is contribution margin by channel so far today?" the answer comes from data Bruin loaded, not from an export someone ran this morning.
The numbers are defined once. You write the definition of net revenue, discount treatment, and attribution basis once, in October. Every answer through January uses the same definitions, and every answer shows the query it used, so when a number looks surprising your team can check the receipt instead of arguing about it.
The alerts and the questions live where the team already is. Bruin posts the stockout alert, the ROAS floor breach, and the daily pacing summary into Slack, Microsoft Teams, Google Chat, WhatsApp, Discord, Telegram, email, or the browser, and answers follow-up questions in the same thread. On Black Friday nobody has time to open another tab.
The point is not that Bruin has an AI that talks. It is that the AI sits on top of ingestion and modeling it controls, so the number you make a $50k decision on at 11pm is real, deduped, and traceable. See the ecommerce solution page for how brands run it.
The one-page checklist
- Every order and dollar source listed, with refresh rate and peak API limits checked
- Last year's Q4 rebuilt from raw data and compared to what was reported
- Timezone, currency, and order-date basis chosen and documented
- Net revenue, contribution margin, inventory cover, and blended ROAS defined and frozen
- Gift card, pre-order, bundle, and discount-stacking treatment decided
- Live "today so far," inventory cover, spend pacing, and promo views built
- Alerts set for zero orders, low cover, discount leaks, refund spikes, and ROAS floor
- Pipeline dry-run at 10x volume, sync times acceptable
- Campaign, code, and UTM naming conventions agreed
- January calendar blocked for returns tracking and the real P&L
FAQ
When should I start preparing analytics for Black Friday?
September. The source audit and last-year reconciliation take two to three weeks for a typical brand, and you want October free for freezing definitions, building the peak views, and dry-running under load. Starting in November means finding the broken sync during the event.
What is the most common thing that goes wrong with ecommerce analytics during BFCM?
Stale or partial data presented as current. A sync that lags two hours at 10x volume, or a channel that was never connected and gets added by hand from a CSV, quietly turns "today so far" into a guess. The second most common issue is trusting platform-reported revenue from ad networks, which double-count at peak more than at any other time.
Do I need a data warehouse to do this?
You need one place where every source lands and one set of definitions applied to it. Historically that meant a warehouse plus a pipeline project. Today the ingestion and modeling can be handled by a platform like Bruin, so the requirement is a decision about definitions rather than an engineering build.
How should I handle attribution during Cyber Week?
Use your own order data as the denominator for blended CAC and ROAS, and treat each ad platform's reported revenue as a directional signal for optimizing creative and audiences. Do not sum platform-reported revenue across Meta, Google, and TikTok; the overlap during Cyber Week is severe and you will overstate what you earned.
How do I know if Black Friday was actually profitable?
Wait for returns. Compute contribution margin by promotion and by channel in late January, after the return window closes and marketplace fees have settled, and pair it with the repeat-purchase rate of first-time Black Friday buyers. A promotion that shows strong November revenue, a 30 percent return rate, and no repeat purchases bought revenue rather than customers.
Can I get alerts instead of watching dashboards all weekend?
Yes, and that is the point of preparing in October. Define the thresholds (zero orders for 15 minutes, a hero SKU under a day of cover, discount rate above plan, blended ROAS under floor) and have them post into your team's channel automatically. With Bruin the alert and the follow-up question ("which location has the stock?") happen in the same Slack or Teams thread. Get started at github.com/bruin-data/bruin.