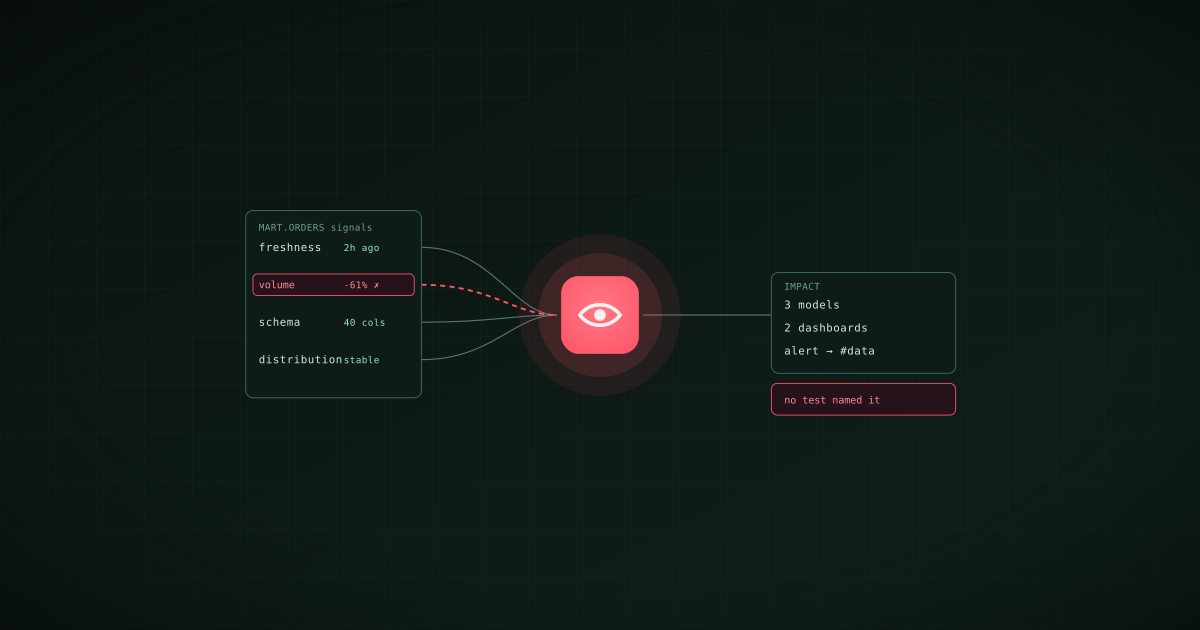
Data observability is the practice of continuously monitoring the health of data in production, its freshness, volume, schema, value distribution, and lineage, so that problems are detected and traced even when nobody wrote a check for them. It borrows the idea from software observability: you cannot predict every failure, so you instrument the system well enough to notice and diagnose the ones you did not predict. Data testing is the complementary practice: asserting, before a table ships, the specific things that must be true of it. Teams need both, and they are often sold as if one replaced the other. Bruin runs the tests as checks inside the pipeline and derives the observability signals from the pipeline's own runs; Monte Carlo, Elementary, and Soda are the tools most teams compare when they buy observability separately.
The five signals
| Signal | The question it answers | Example failure it catches |
|---|---|---|
| Freshness | When did this table last update, and is that late? | The 03:00 load silently stopped on Friday; the dashboard shows Thursday's numbers all weekend |
| Volume | How many rows arrived, compared with what usually arrives? | A source filter changed and orders dropped 60% with no error |
| Schema | Did columns appear, disappear, or change type? | The CRM upgrade renamed amount to amount_usd and the model now reads null |
| Distribution | Did the values shift? | A currency bug multiplied every European order by 100 |
| Lineage | What depends on this table? | Which of the 40 dashboards is wrong because of the failure above |
Testing versus observability
A test says: order_total must be non-negative, order_id must be unique, this table must have updated in the last six hours. It runs when the table is built and passes or fails. It is precise, cheap, and blind to anything it does not name.
Observability says: here is what this table normally looks like, and here is how today differs. It is broad, needs history to learn from, and cannot block a run on its own because it deals in anomalies rather than rules.
| Testing | Observability | |
|---|---|---|
| When it runs | On every pipeline run, before downstream steps | Continuously, on tables in production |
| What it knows | The rules you wrote | The history it has learned |
| What it catches | Predicted failures | Unpredicted changes |
| Can it block a run? | Yes | Rarely; it alerts |
| Where it lives | In the pipeline, next to the asset | Beside the pipeline, reading the warehouse |
The failure mode of testing alone is the volume drop nobody asserted. The failure mode of observability alone is a bad table that shipped to a dashboard an hour before the anomaly alert fired.
How Bruin does it
Bruin puts the tests in the pipeline and derives the observability signals from it, so there is one system rather than two.
Checks are declared on the asset that produces the table and block downstream runs when they fail:
/* @bruin
name: mart.orders
type: sf.sql
depends:
  - raw.orders
columns:
  - name: order_id
    checks:
      - name: not_null
      - name: unique
custom_checks:
  - name: freshness_6h
    query: select max(updated_at) < dateadd(hour, -6, current_timestamp) from mart.orders
    value: false
  - name: volume_vs_trailing_week
    query: |
      select count(*) < 0.5 * (select count(*) / 7 from mart.orders
        where ordered_at >= dateadd(day, -7, current_date))
      from mart.orders where ordered_at = current_date
    value: false
@bruin */
Schema is known because Bruin parses the SQL and the asset definitions; column-level lineage is derived from the same parse, so bruin lineage mart.orders --full answers "what depends on this" without a query log. Bruin Cloud shows freshness, run history, and check results per asset, and the pipeline's notification block sends failures to Slack or Microsoft Teams. For the testing side in full, see what is a data quality check and data quality and testing strategies for pipelines.
When to buy a dedicated tool
A dedicated observability platform earns its cost when the warehouse has many producers outside one pipeline: dozens of teams writing tables with different tools, third-party loads you do not control, and hundreds of tables nobody has declared checks on. Monte Carlo learns baselines across all of them and alerts on anomalies without per-table configuration. Elementary does a lighter version of that for dbt projects, open source. For a team whose data flows through one pipeline it owns, checks on every asset plus freshness, lineage, and alerts from the pipeline cover the same ground with nothing extra to run, which is the case Bruin is built for. The tool-by-tool comparison is in the best data quality tools in 2026.