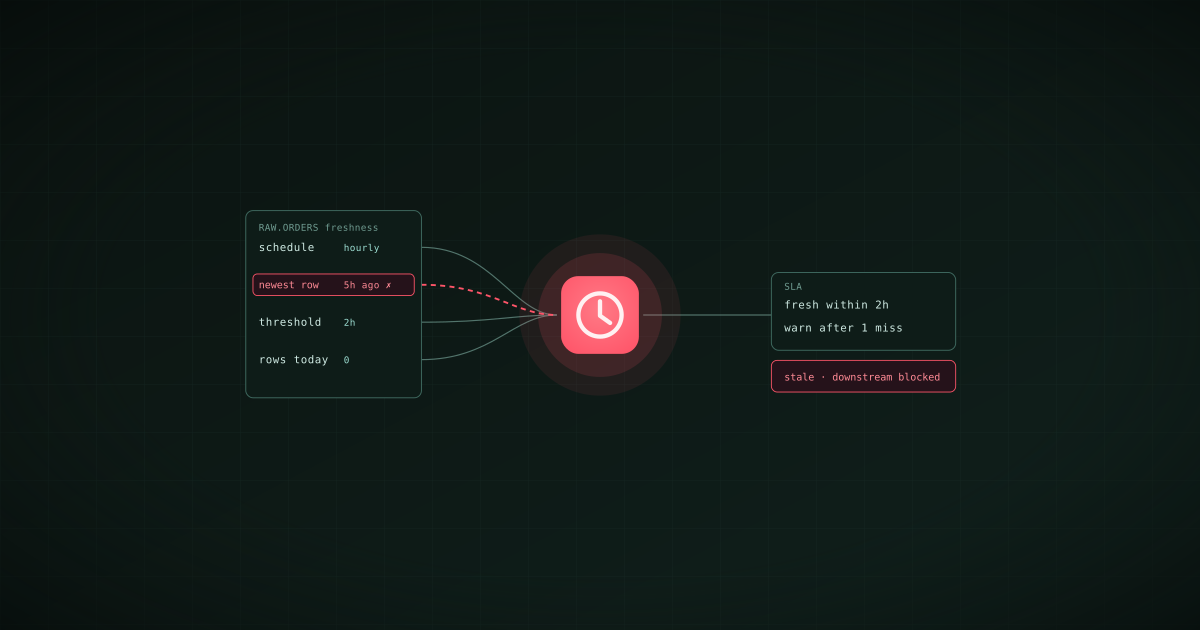
Data freshness is how old the newest data in a table is, measured against when it was supposed to arrive. A table that loads every hour and whose latest row is from five hours ago is stale, whatever the latency of the pipeline that normally fills it. Completeness is the companion measure: whether the rows that should be in the latest load actually are. Together they catch the most expensive class of data incident, the pipeline that quietly stopped, and both can be checked inside the pipeline with two lines of SQL. In Bruin they are custom checks declared on the asset; dbt has source freshness for raw sources; observability tools add anomaly detection on top.
Why freshness is the check teams add too late
Most quality checks assert something about the rows that arrived. Freshness asserts something about the rows that did not. That difference is why teams discover they need it after an incident: the null checks passed, the uniqueness checks passed, and the dashboard showed last Thursday's numbers for four days because nothing was written to the table and nothing tested for that.
The failure modes it catches are ordinary. A credential expired and the load has been erroring in a log nobody reads. A source API changed its pagination and returns an empty page. A scheduler is up but a worker is not. In each case the table exists, the schema is fine, and the data is old.
How to define it
A freshness rule needs three inputs:
- The timestamp column that records when a row was loaded or last changed, such as
updated_ator_loaded_at. If the source has none, the loader should add one. - The expected interval, which is the pipeline's schedule: hourly, daily, every 15 minutes.
- The threshold, which is how late is too late. Twice the interval is a sane default: an hourly table gets a two-hour threshold, so one failed run raises a warning and two raise an alert.
Completeness needs a fourth: what "complete" means for the latest period. For a daily load, that might be "at least one row for today" or "row count within 30% of the trailing seven-day average". The first is a check you can write; the second is what observability tools compute for you.
Checking it inside the pipeline
The cheapest place for the check is on the table itself, so it runs with every pipeline run and blocks the assets downstream. In Bruin that is a custom_checks block on the asset:
/* @bruin
name: raw.orders
type: ingestr
parameters:
  source_connection: postgres_prod
  source_table: public.orders
  destination: snowflake
materialization:
  type: table
  strategy: append
  incremental_key: updated_at
custom_checks:
  - name: fresh within 2 hours
    query: SELECT max(updated_at) > current_timestamp - interval '2 hours' FROM raw.orders
    value: 1
  - name: rows arrived today
    query: SELECT count(*) FROM raw.orders WHERE updated_at::date = current_date
    count: 1
    blocking: false
@bruin */
The first check fails the asset, and stops everything downstream, when the newest row is more than two hours old. The second is a completeness check on today's partition, marked non-blocking so a slow source produces a warning rather than a stopped pipeline. Because Bruin runs checks as part of the asset, an hourly pipeline re-validates freshness every hour with no separate monitoring job to schedule.
In dbt the equivalent for raw sources is freshness: with warn_after and error_after in the source YAML, run by dbt source freshness. Soda writes freshness(updated_at) < 2h. Great Expectations expresses it as an expectation on the maximum of the timestamp column.
The gap a check cannot close
A freshness check runs when the pipeline runs. If the scheduler itself is down, nothing runs and nothing fails. Two things close that gap: a schedule-level alert from the orchestrator when a run does not start on time, which Bruin Cloud raises from the pipeline schedule, and an observability tool that watches the warehouse independently of the pipeline. The check catches the empty load; the monitor catches the missing run.
Freshness is one check in a broader set. For which checks to add first and where each should run, see what is a data quality check and data quality and testing strategies for modern pipelines.