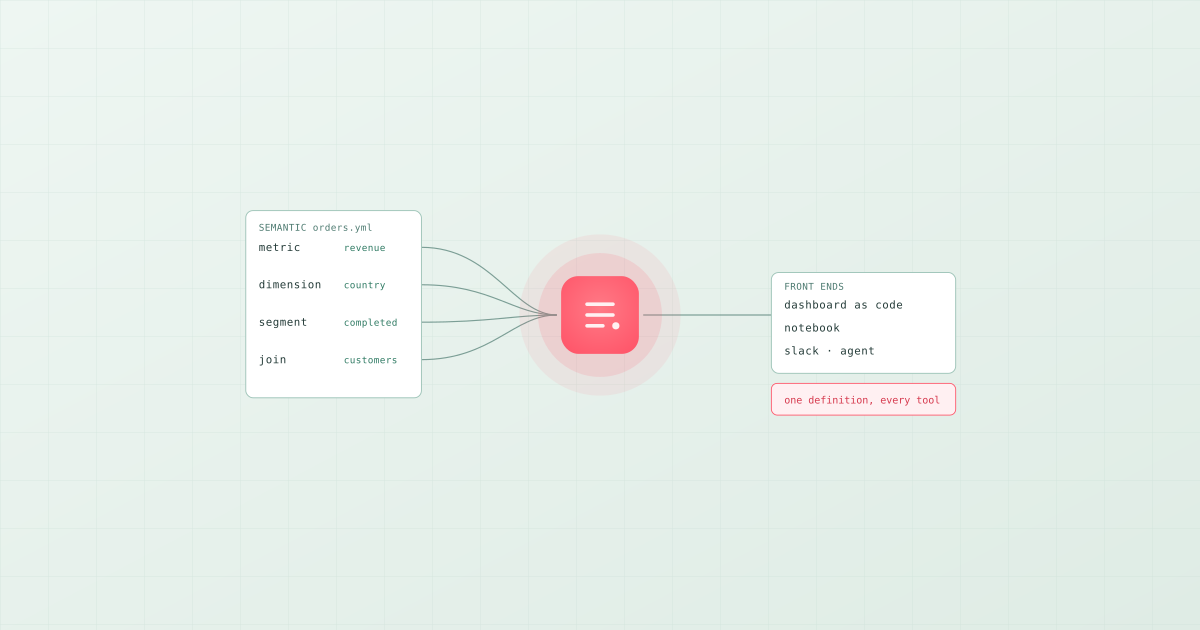
Headless BI separates the two halves of a business intelligence tool: the semantic layer that defines metrics, dimensions, and joins, and the front end that draws charts. A headless tool keeps the first half and exposes it through an API, so any front end, a dashboard, a notebook, a spreadsheet, or an AI agent, asks the same governed definitions for the same numbers. Code-first BI is the practice that usually comes with it: the definitions, and often the dashboards themselves, are files in a repository rather than objects in a UI. Cube is the reference headless tool; Bruin is the code-first option where the semantic layer lives next to the pipeline that produces the data.
The problem it solves
In a traditional BI tool, the metric definitions live inside the tool. Revenue is defined in Looker's LookML, or a Power BI dataset, or a Tableau data source. Then a second tool arrives, a notebook, an embedded chart in the product, an AI assistant, and each one defines revenue again, slightly differently. Within a year there are four revenues and a monthly argument about which is right.
Headless BI moves the definition out of the front end and into a layer every front end shares. One definition of revenue, compiled to SQL on demand, served to whichever tool asked.
How it works
Three parts:
| Part | What it holds | Where it lives in a headless setup |
|---|---|---|
| Semantic model | Metrics (revenue = sum of net amount), dimensions (country, plan, month), segments, and the joins that are safe to follow | YAML files in a repository |
| Query engine | Compiles "revenue by country for completed orders" into SQL against the warehouse | The headless tool's CLI or API |
| Front ends | Whatever renders the result | Dashboards, notebooks, embedded charts, spreadsheets, AI agents |
In Bruin the semantic model is a semantic/ directory in the pipeline repository:
schema: v1
name: orders
source:
  table: mart.orders
primary_key: order_id
dimensions:
  - name: country
    type: string
  - name: order_date
    type: time
metrics:
  - name: revenue
    expression: sum(order_total_eur)
  - name: orders
    expression: count(order_id)
segments:
  - name: completed
    filter: "status in ('paid', 'shipped')"
bruin query --semantic-model orders --metric revenue --dimension country --segment completed
The definitions are reviewed like code, versioned with the pipeline, and queried by the CLI, by dashboards, and by the AI data analyst that answers in Slack and Microsoft Teams. Because the semantic layer sits in the same repository as the ingestion and transformation that produce mart.orders, a change to the model and the change to the metric it affects ship in one pull request. That is the practical difference between a headless layer beside the pipeline and one inside it.
Code-first BI: dashboards as files
Headless BI removes the front end from the definitions. Code-first BI goes one step further and makes the front end code too. Dashboards are YAML or TSX files, diffed in pull requests, validated in CI, and served from source control. Bruin's dashboards-as-code workflow does this on top of the semantic layer; Evidence renders reports from SQL and Markdown; Lightdash defines metrics in dbt YAML with its own explorer for the last mile.
What you gain is review, rollback, and reproducibility, the same properties pipelines as code gives the pipeline. What you give up is the drag-and-drop authoring that business users expect, which is why most code-first setups pair the governed layer with a conversational front end: the analyst asks in plain English, the semantic layer answers with the governed definition, and nobody needs the drag-and-drop.
Where each tool fits
- Cube: the purest headless layer. SQL, REST, and GraphQL APIs, caching, access control. Pick it for embedded analytics and customer-facing products where the API is the product.
- Bruin: semantic layer and dashboards as code inside the pipeline repository, queried by the CLI, an API, and the AI data analyst. Pick it when the definitions should live next to the data that produces them and the consumers include chat and agents.
- dbt Semantic Layer and MetricFlow: metrics defined in dbt YAML, for stacks where dbt is the centre.
- Lightdash: dbt metrics with a ready-made explorer. Pick it for dbt teams that want a UI without leaving code-defined metrics.
- Evidence: reports as SQL and Markdown, rendered as static pages. Pick it for narrative reporting.
For the full comparison including Looker, Power BI, and AtScale, see the best semantic layer tools.