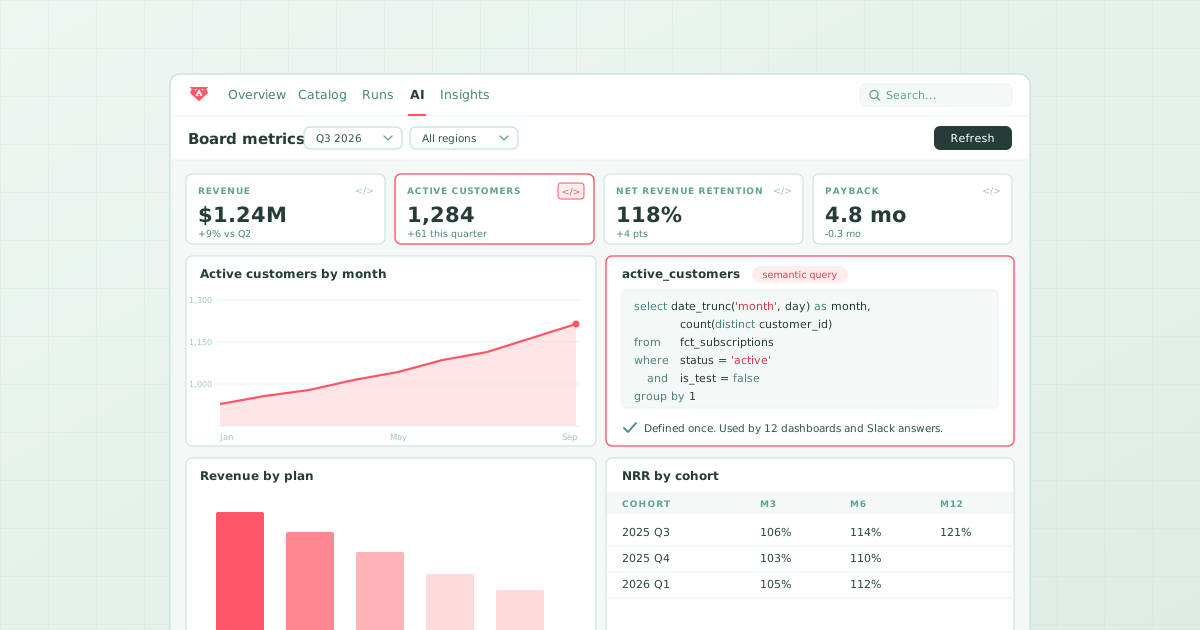
Short answer: Claude Dashboards can replace the dashboard request, not the BI tool. Anthropic's Dashboards beta, released on 8 October 2026, builds a live dashboard from a plain-language question by writing a SQL query per chart against Snowflake, BigQuery, Databricks, Redshift, or ClickHouse. That makes one-off dashboards almost free. But a BI tool does more than draw charts: it holds one definition of each metric, sits on data someone has tested, goes through review when it changes, and is the one place everyone agrees is official. Claude Dashboards does the first part brilliantly and, by Anthropic's own description, leaves the rest to other tools. Teams that want AI-built dashboards with that governed layer underneath use a platform such as Bruin.
What a BI tool actually does
When people say "we need a BI tool," they usually mean four jobs, not one.
- Draw the chart. Turn a question into a query and a visual.
- Define the metric once. "Revenue" and "active user" mean the same thing on every dashboard, because the definition lives in a semantic model that every chart reads.
- Stand on tested data. The tables under the chart were loaded, modelled, and checked by a pipeline someone owns.
- Change safely. A dashboard has an owner, a review process, and a history, so a change to the board deck number does not happen by accident.
Traditional BI (Looker, Tableau, Power BI) does jobs 1, 2, and 4, and relies on a separate pipeline for job 3. The complaint about it is that job 1 is slow: a request, a ticket, a sprint.
What Claude Dashboards replaces
Claude Dashboards makes job 1 fast. You ask "compare this week's signups with last month's," Claude writes the SQL, runs it, and lays out the result. Every chart shows its query and when it last refreshed, and you can click a number and ask Claude to explain it. Live queries run through each viewer's own connector, so permissions carry over.
That genuinely replaces a few things:
- The ad-hoc request queue. Most dashboard tickets are one-off questions. Those no longer need a data person to build anything.
- The throwaway dashboard. The one built for a single meeting and never opened again.
- The screenshot in Slack. A link to a live, checkable chart is better than a picture of one.
What it does not replace
Jobs 2, 3, and 4 are where Claude Dashboards, in its current beta, stops.
| Job | Traditional BI | Claude Dashboards | Bruin |
|---|---|---|---|
| Draw the chart from a question | Slow: built by hand | Fast: SQL per chart from a prompt | Fast: an agent builds it from a prompt |
| Define the metric once | Yes, semantic model | No: each chart writes its own SQL | Yes: shared semantic and named queries |
| Stand on tested data | Relies on a separate pipeline | Relies on whatever is in the warehouse | Yes: loads, models, and checks the data itself |
| Change safely | Yes: owners, review, history | Versions on claude.ai | Draft and publish in Bruin Cloud; dashboards as code in pull requests |
No shared definition. Because Claude writes a query per chart, the definition of "active customer" lives inside each dashboard. Two people can build two dashboards that disagree, and both will explain themselves clearly. For exploration that is fine. For the number in the board deck it is the problem BI was invented to solve.
No view of the pipeline. Claude queries the warehouse as it is. If last night's load failed, the dashboard refreshes, shows a new timestamp, and charts stale rows. Nothing in the dashboard knows a load ran, let alone that it failed.
No home outside claude.ai. A Claude dashboard is an artifact with versions on claude.ai. It does not go through the pull request and review your other data work goes through, and nothing marks one revenue dashboard as the official one.
Anthropic is clear about this. Its help article describes Dashboards as "designed for quick, exploratory questions," and the product ships with an export to Hex, Sigma, Omni, Amplitude, Mixpanel, PostHog, Grafana, and Perplexity for deeper analysis, with Looker and Tableau on the way. Claude Dashboards is positioned as the front of the funnel, not the replacement for what is behind it.
Where Bruin fits
Bruin is a data platform with AI dashboards on top, so it does all four jobs in one place. The agent builds a dashboard from a prompt, like Claude. The dashboard reads shared semantic and named queries, so the definition lives once. The tables underneath are loaded with ingestr, modelled in SQL and Python, and protected by quality checks that stop a bad run before it reaches a chart. Every number traces back through column-level lineage. And if you want dashboards reviewed like code, Bruin's open-source dac keeps them as YAML or TSX files in your repository.
For a small team without a BI tool yet, that can be the whole BI layer. For a team with a large Looker or Tableau estate, Bruin usually runs alongside it first and takes over the new dashboards. And for a team that loves Claude, the two work together: Bruin keeps the warehouse tables loaded, modelled, and checked, and Claude Dashboards queries those tables for quick views.
A simple test
A dashboard can live in Claude if:
- It answers one question for one meeting or one week.
- The warehouse under it is already modelled and tested by a data team.
- Someone who reads SQL will check the query before anyone acts on it.
It needs a governed home if:
- More than one team reads the same metric.
- It is reviewed every week and has to match last week's number.
- A wrong number would change a decision about money, hiring, or customers.
Best tool by need
- A quick chart for a one-off question on a clean warehouse: Claude Dashboards.
- AI-built dashboards on data that is loaded, modelled, checked, and traced in one platform: Bruin.
- A mature BI estate with a semantic model already in place: Looker, Tableau, or Power BI, with Claude or Bruin for the fast questions.
- Notebook-style analysis after a quick look: Hex.
- A spreadsheet-style BI tool on a modelled warehouse: Sigma.
So no, Claude Dashboards does not replace your BI tool. It replaces the slowest part of it and leaves the hard part, a number everyone can trust, where it was. For the head-to-head, read Claude Dashboards vs Bruin AI dashboards or the comparison page.